
FIGURE 3.
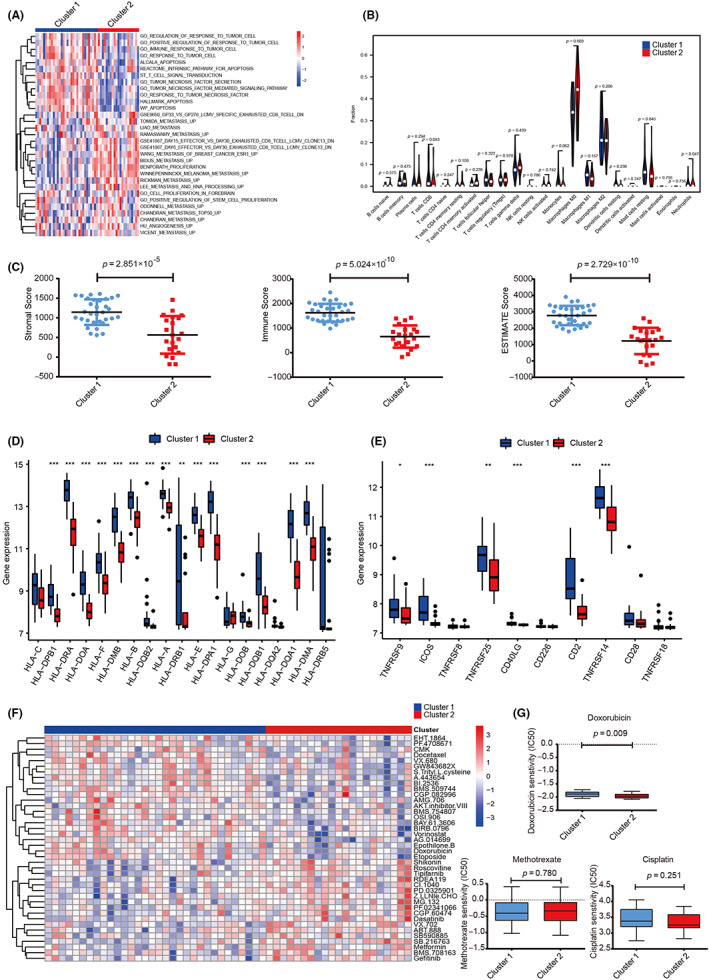
Physiological characteristics of the two clusters of osteosarcoma subtypes. (A) Heatmap showing the differences in enrichment in different gene sets between the two clusters. The deeper the red, the higher the enrichment. (B) Violin diagram showing the infiltration of 22 immune cells in two clusters. (C) Scatter plots shows immune score, stromal score, and ESTIMATE score of two clusters. (D) Boxplot showing the expression of human leukocyte antigen genes in two clusters. (E) Boxplot showing the expression of T‐cell stimulating factor genes in two clusters. (F) Heatmap showing 40 statistically significant drugs between cluster 1 and cluster 2. (G) Boxplot showing IC50 values of two clusters against classic osteosarcoma chemotherapy drugs. *p < 0.05, **p < 0.01, ***p < 0.001.