
FIGURE 5.
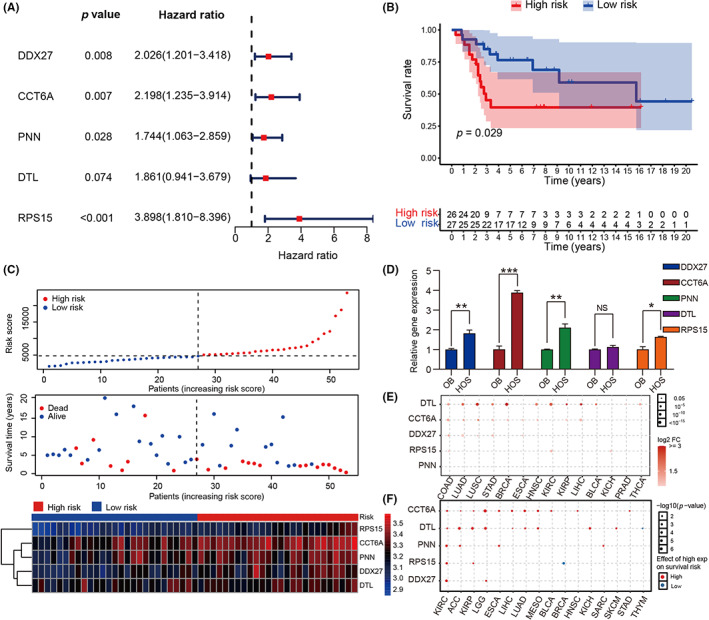
Clinical implications of model genes and prognostic model. (A) Effects of five model genes on survival of patients with osteosarcoma were analyzed by univariate Cox regression risk analysis. (B) Survival analysis between cluster 1 and cluster 2. (C) Top panel, distribution of risk scores. Middle panel, each patient's survival status. Bottom panel, heatmap showing the expression of the five model genes. (D) Quantitative RT‐PCR detected the expression level of the five model genes in hFOB1.19 (OB) and HOS. (E) Expression of the five model genes in pan‐cancer. The deeper the red, the higher the expression in pan‐cancer; the larger the dot, the smaller the p value. (F) Survival analysis of the five model genes in pan‐cancer showing that higher expression level (red) was associated with worse survival. The larger the point, the smaller the p value. *p < 0.05, **p < 0.01, ***p < 0.001. FC, fold change; NS, no statistically significant.