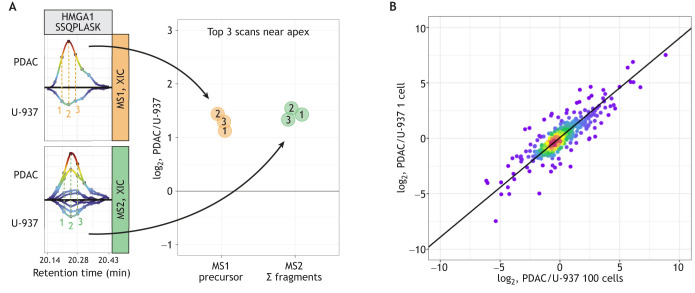
Fig. 2.
Quantitative accuracy of single-cell proteomics. (A) Raw mass spectrometry (MS) data from Derks et al. (2023) for the quantification of the peptide SSQPLASK from the protein high mobility group AT-hook 1 (HMGA1). The precursor peptide ions from two single cells, one pancreatic ductal adenocarcinoma (PDAC) cell and one U-937 (pro-monocytic model cell line) cell (orange panel), and their corresponding fragment ions (Σ fragments; green panel) are shown. Both the peptide (MS1-level) and the fragment (MS2-level) ions are measured in multiple scans (labeled 1, 2 and 3), and each of these measurements can be used to estimate the abundance of the peptide. Adapted, with permission, from Gatto et al. (2023). (B) Comparison of relative protein levels measured by plexDIA in single cells (y-axis) and in bulk samples composed of 100 cells (x-axis) (Derks et al., 2023). XIC, extracted ion chromatograms.

