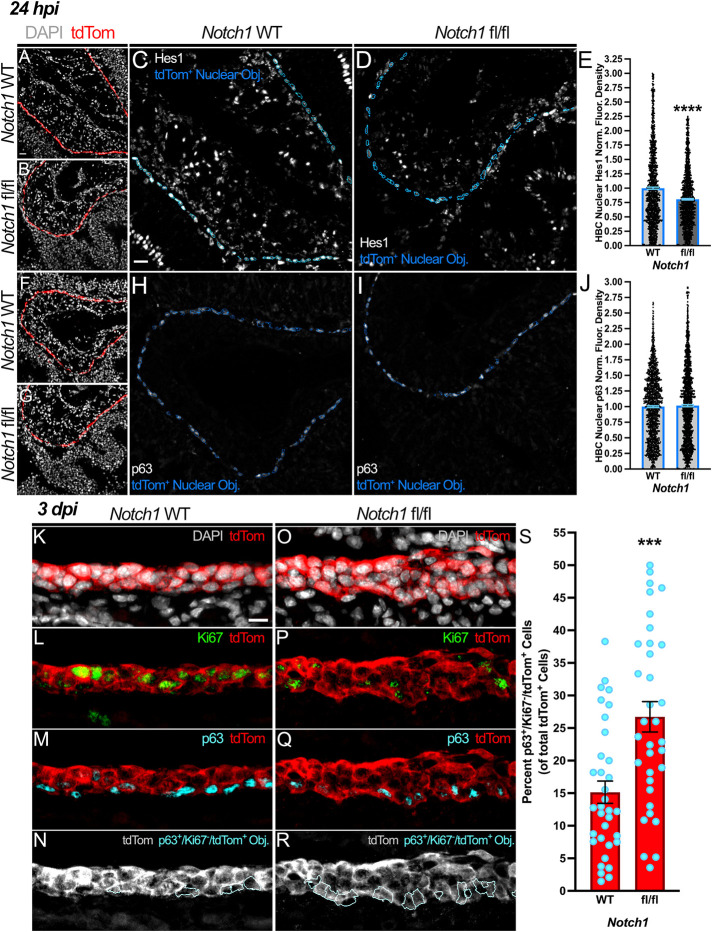
Fig. 3.
Attenuated Notch1-mediated signaling during OE regeneration at 24 hpi correlates with increased HBC quiescence at 3 dpi. (A-D) At 24 hpi, HBCs within Notch1 fl/fl OE (B,D) relative to those within Notch1 WT OE (A,C) demonstrate diminished Notch signaling activity, as evidenced by decreased nuclear Hes1 (within blue outlines, C and D). (E) Quantification of HBC nuclear Hes1 normalized fluorescence density, each point represents a tdTom+ Nuclear Object (as represented by blue outlines in C and D) (n=4 mice, 1596 Notch1 WT HBCs and 1562 Notch1 fl/fl HBCs). (F-I) Relative to control (F,H), HBCs within Notch1 fl/fl OE (G,I) demonstrate no significant change in nuclear p63 expression (within blue outlines, H and I) at 24 hpi. (J) Quantification of HBC nuclear p63 normalized fluorescence density, each point represents a tdTom+ Nuclear Object (as represented by blue outlines in H and I) (n=4 mice, 1670 Notch1 WT HBCs and 1510 Notch1 fl/fl HBCs). (K-R) Relative to control (K-N), the proportion of quiescent HBCs (cyan outlines, N and R) amongst all HBC-derived cells within the regenerating OE at 3 dpi decreases following HBC-specific Notch1 cKO (O-R). (S) Each circle represents an analyzed region, as represented in N and R (n=3 mice, 34 Notch1 WT regions and 34 Notch1 fl/fl regions). Notch1 WT is used as baseline (E,J), data are mean±s.e.m., Mann–Whitney test, ***P<0.001, ****P<0.0001 (E,J,S). Scale bars: 20 μm (A,C); 10 μm (K).

