Fig. 4.
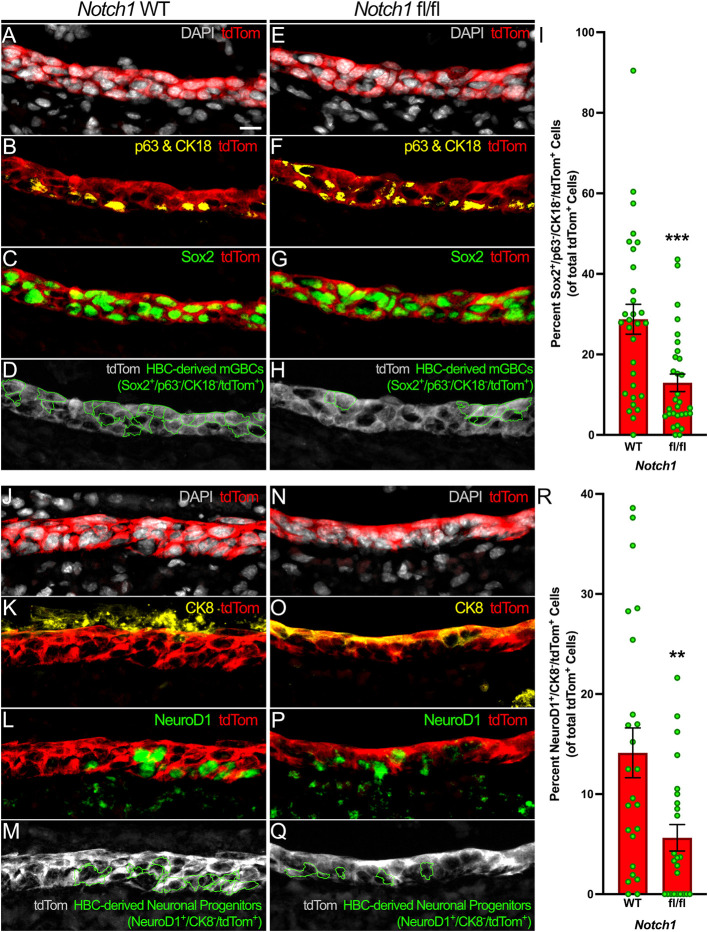
Notch1 cKO decreases HBC differentiation towards mGBCs and neuronal progenitors. (A-H) Relative to control (A-D), the proportion of HBCs that differentiate into Sox2+/p63−/CK18−/tdTom+ mGBCs (green outlines, D and H) within the regenerating OE at 3 dpi decreases following HBC-specific Notch1 cKO (E-H). (I) Each circle represents an analyzed region, as represented in D and H (n=3 mice, 30 Notch1 WT regions and 30 Notch1 fl/fl regions). (J-Q) Relative to control (J-M), the proportion of HBCs that differentiate into NeuroD1+/CK8−/tdTom+ neuronal progenitors (green outlines, M and Q) within the regenerating OE at 3 dpi decreases following HBC-specific Notch1 cKO (N-Q). (R) Each circle represents an analyzed region, as represented in M and Q (n=3 mice, 24 Notch1 WT regions and 24 Notch1 fl/fl regions). Data are mean±s.e.m., Mann–Whitney test, **P<0.01, ***P<0.001 (I,R). Scale bar: 10 μm.

