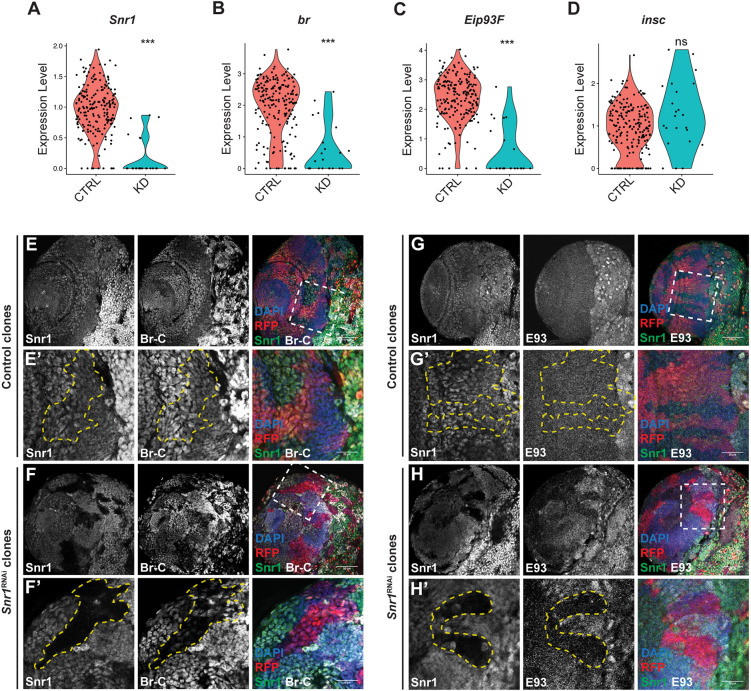
Fig. 7.
Expression of Broad (br) and Eip93F is reduced in Snr1 knockdown cells. (A-D) Violin plots showing expression of Snr1 (log2FC=-1.17, P=6e-11), br (log2FC=-1.94, P=1e-8), Eip93F (log2FC=-2.34, P=2e-11) and inscuteable (insc) (P=0.10) in neuroblasts from control brains and from brains expressing Snr1RNAi in neuroblasts. ***P<0.001; ns, not significant. (E) FLP-out control clones. (E′) Higher magnification images of the region outlined in E. Clone is outlined by a yellow dashed line. (F) FLP-out clones expressing Snr1RNAi. (F′) Higher magnification image of the region outlined in F. Clone is outlined by a yellow dashed line. In merged images in E-F′, Snr1 is shown in green, Broad-Core (Br-C) is in white, RFP is in red and DAPI is in blue. (G) FLP-out control clones. (G′) Higher magnification image of region outlined in G. Clone is outlined by a yellow dashed line. (H) FLP-out clones expressing Snr1RNAi. (H′) Higher magnification image of region outlined in H. Clone is outlined by a yellow dashed line. In merged images in G-H′, Snr1 is shown in green, Eip93F (E93) is in white, RFP is in red and DAPI is in blue. Scale bars: 50 µm in E,F,G,H; 20 µm in E′,F′,G′,H′.

