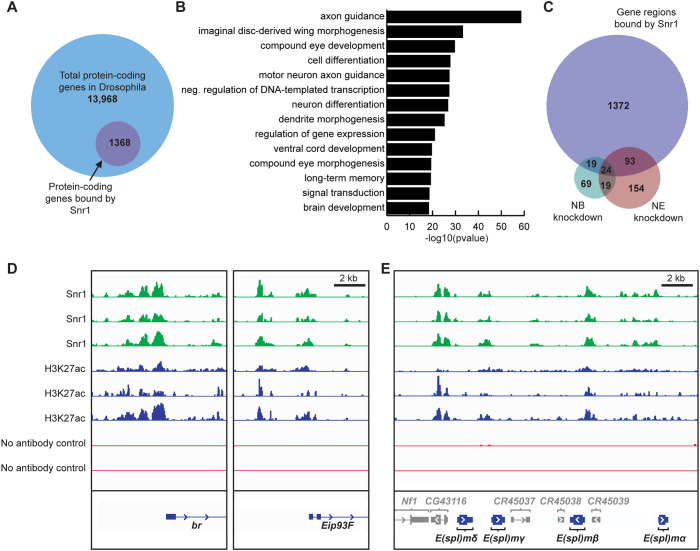
Fig. 8.
Chromatin profiling reveals Snr1 occupancy at genes involved in brain development. (A) Proportion of total protein-coding genes bound by Snr1. (B) Over-represented gene ontology terms associated with genes bound by Snr1. (C) Venn diagram comparing genes significantly downregulated in neuroblasts identified by scRNA-Seq with genes found in regions of chromatin bound by Snr1. Differentially expressed genes were identified from brains with Snr1 knockdown in neuroepithelial cells (NE knockdown) or Snr1 knockdown in neuroblasts (NB knockdown). (D) Chromatin profiling plots showing replicate experiments. Representative isoforms of broad (br) and Eip93F are shown. (E) Chromatin profiles of Enhancer of split complex genes.

