. 2023 Apr 18;307(4):e222045. doi: 10.1148/radiol.222045

Figure 2:

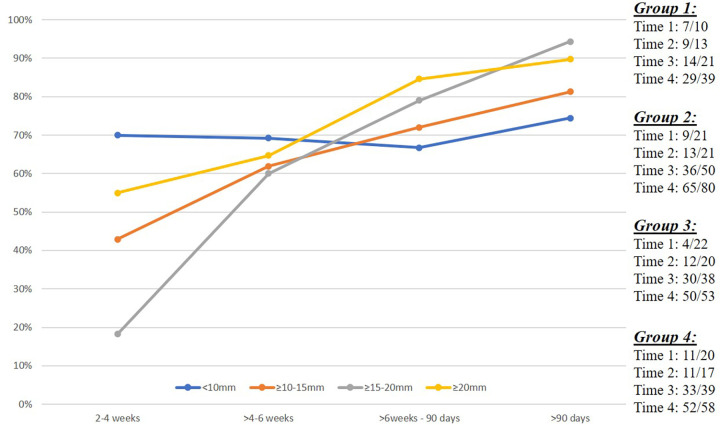
Temporal depiction of chronic subdural hematoma (CSDH) response after middle meningeal artery (MMA) embolization. Line graph shows the percentage of CSDHs that achieved radiographic success (≥50% reduction in maximal hematoma thickness), stratified according to preprocedural CSDH maximal thickness (group 1, <10 mm; group 2, 10 mm to <15 mm; group 3, 15 mm to <20 mm, and group 4, ≥20 mm) over prespecified imaging follow-up intervals, including 2–4 weeks (14–28 days), greater than 4 weeks to 6 weeks (29–42 days), 6 weeks to 90 days (43–90 days), and greater than 90 days. The data on the right indicate the number of cases achieving the end point (numerator) from the total cases (denominator) for each CSDH group over each time interval.

Temporal depiction of chronic subdural hematoma (CSDH) response after middle meningeal artery (MMA) embolization. Line graph shows the percentage of CSDHs that achieved radiographic success (≥50% reduction in maximal hematoma thickness), stratified according to preprocedural CSDH maximal thickness (group 1, <10 mm; group 2, 10 mm to <15 mm; group 3, 15 mm to <20 mm, and group 4, ≥20 mm) over prespecified imaging follow-up intervals, including 2–4 weeks (14–28 days), greater than 4 weeks to 6 weeks (29–42 days), 6 weeks to 90 days (43–90 days), and greater than 90 days. The data on the right indicate the number of cases achieving the end point (numerator) from the total cases (denominator) for each CSDH group over each time interval.