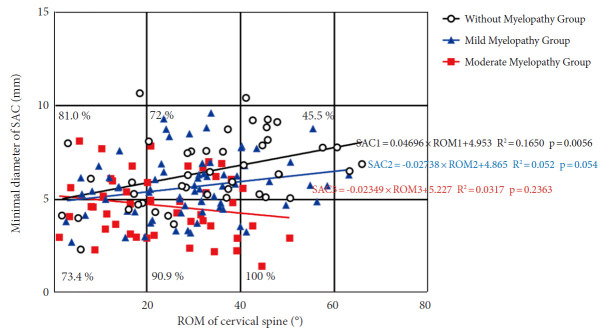
Fig. 5.
A scatterplot depicting the relationship between SAC and ROM in OPLL patients' cervical spines. Open circles indicate no myelopathy; blue circles indicate mild myelopathy; and red circles indicate moderate myelopathy. The percentage represents the number of myelopathy patients in each square. SAC, space available for the spinal cord; ROM, range of motion; OPLL, ossification of the posterior longitudinal ligament.

