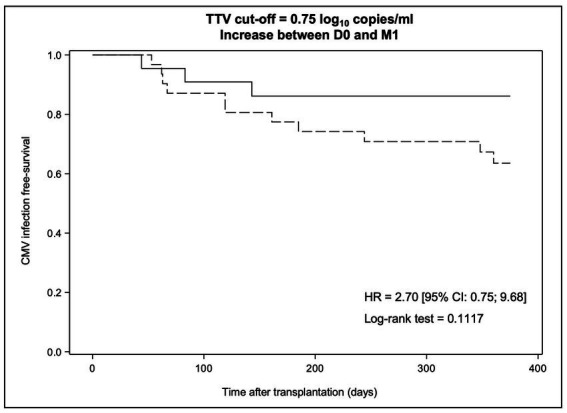
Figure 4.

Kaplan–Meier survival curves modelling freedom from CMV reactivation through day + 360 post-transplant according to the dynamic change in TTV levels between D0 and M1. The dotted line indicates an increase in TTV levels >0.75 log10 copies/ml while the solid line indicates a TTV dynamic change below this value. HR, hazard ratio and CI, confidence interval.
