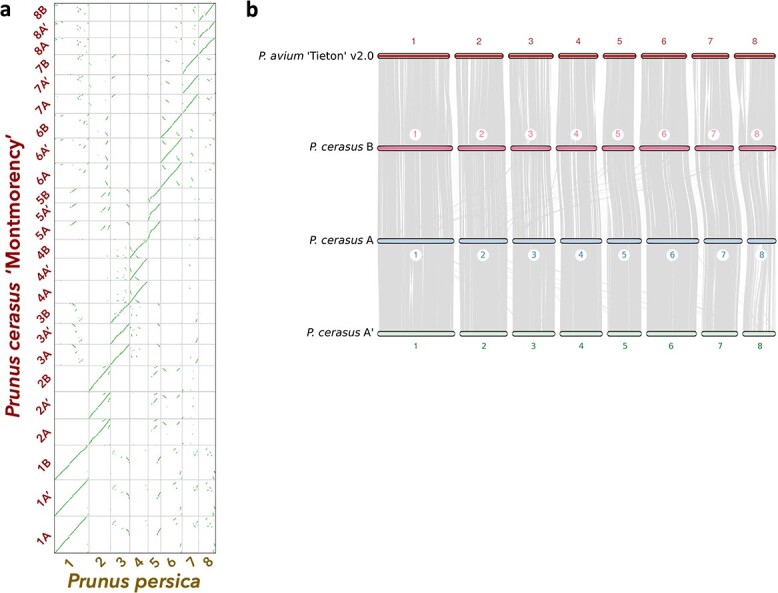
Figure 1.

Syntenic relationships between ‘Montmorency’ subgenomes A, A', and B and other Prunus species. (a) A syntenic dotplot showing the results of a synteny comparison of the 24 superscaffolds (chromosomes) of P. cerasus ‘Montmorency’ and the eight chromosomes of P. persica “Lovell” v2.0 [47]. The figure was generated using unmasked coding sequences for each species with the CoGe platform. The prominent linearity for chr #[A, A', B] for P. cerasus vs the respective chr # in P. persica highlights the collinearity of this genus and supports the integrity of the assembly. (b) Macrosynteny determined with coding sequences shows the three subgenomes of sour cherry are highly syntenic with each other and the published P. avium ‘Tieton’ v2.0 genome [23]. Each gray line represents a syntenic block between the genomes. Small rearrangements between P. avium and each of the ‘Montmorency’ subgenomes are evident.
