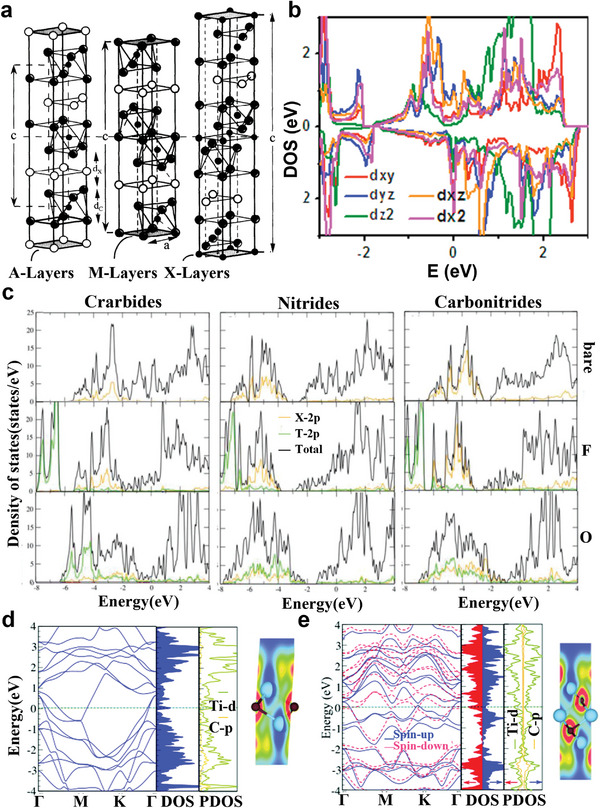
Figure 5.

a) Unit cells of 211, 312, and 413 phases in sequence from left to right. The unit cell is depicted by vertical arrow labeled c and the horizontal dashed line is drawn through the center of the unit cell. Reproduced with permission.[ 123 ] Copyright 2000, Elsevier. b) Plotted partial DOS of d‐orbitals for Ti atoms in pristine Ti3C2 monolayer. Reproduced with permission.[ 124 ] Copyright 2015, Elsevier. c) The projected density of states (PDOS) and total density of states (DOS) for Ti3C2, Ti3N2, and Ti3CN of the bare (first row), —F‐terminated (second row), and —O‐terminated (third row) MXenes. The total DOS, C/N‐2p (X‐site), and T‐2p (terminal) states are shown in black, orange, and green curves, respectively. The middle and surface titanium atoms are represented by red and blue curves. For bare MXenes, the DOS color of the additional type of Ti atom is cyan. The Fermi level is set to 0 eV. Reproduced with permission.[ 7 ] Copyright 2020, Wiley‐VCH. Electronic structure and PDOS of d) Ti2C and e) Ti3C2 monolayers. Contour plots of the electron localization function (ELF). The red (blue) region denotes high (low) electron density. Reproduced with permission.[ 125 ] Copyright 2021, Royal Scoiety of Chemistry.
