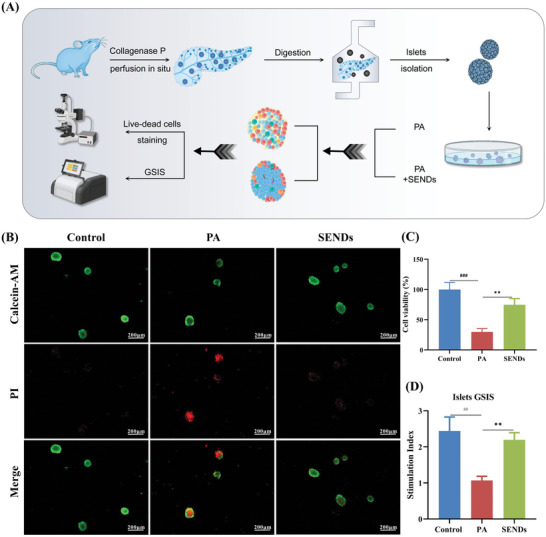
Figure 4.

Islet organoids culture and GSIS experiment in vitro. A) Schematic illustration of pancreatic islet‐like organ culture and GSIS experiment. B) Immunofluorescent staining of Calcein‐AM (green) staining, PI (red) staining, and their merge images of live/dead islet β cells from each group. Scale bar: 200 µm. C) Cell viability of islet β cells from each group. D) Stimulation index of GSIS experiments of pancreatic islet‐like organs from each group. Data represent means ± S.D. from at least three independent replicates. (## p < 0.01, ### p < 0.001 vs Control group; **p < 0.01, ***p < 0.001 vs PA group).
