
Figure 7.
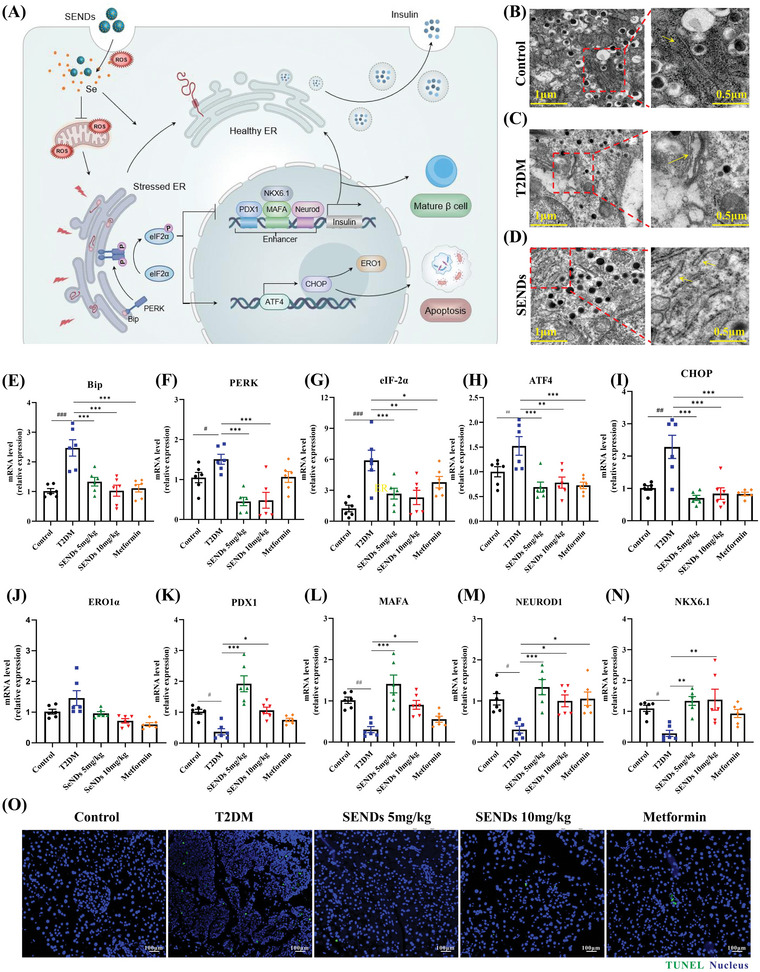
SENDs improve ERS and β cell survival. A) Schematic illustration of SENDs to improve endoplasmic reticulum stress and β‐cell survival. B–D) TEM images of ER in (B) healthy mice, C) diabetic mice, D) diabetic mice after treatment of SENDs and the magnified images. ER is inside the rectangle on the left and pointed by yellow arrow on the right. E–N) mRNA levels of Bip, PERK, eIF‐2α, ATF4, CHOP, ERO1α, PDX1, MAFA, NEUROD1, and NKX6.1 in pancreatic tissues homogenates from each group. O) TUNEL staining (green) and DAPI (blue) merge images of pancreatic tissues from each group. Scale bar: 100 µm. Data represent means ± S.D. from at least three independent replicates (# p < 0.05, ## p < 0.01, ### p < 0.001 vs Control group; *p < 0.05, **p < 0.01, ***p < 0.001 vs T2DM group).