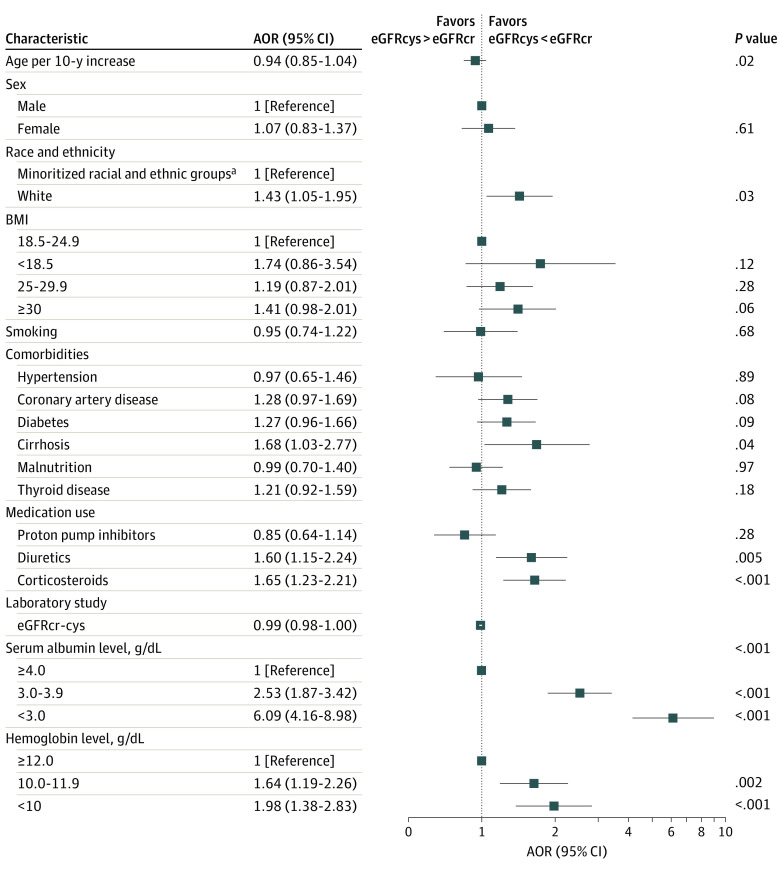
Figure 1. Factors in Estimated Glomerular Filtration Rate (eGFR) Discordance.
Logistic regression models were used to estimate the association between baseline characteristics and having a cystatin C–based eGFR (eGFRcys) that was more than 30% lower than the serum creatinine–based eGFR (eGFRcr) or an eGFRcys that was more than 30% higher than the eGFRcr. AOR indicates adjusted odds ratio; BMI, body mass index (calculated as weight in kilograms divided by height in meters squared); eGFRcr-cys, eGFR using the Chronic Kidney Disease Epidemiology Collaboration race-free combined equation. To convert hemoglobin level to grams per liter, multiply by 10.0; serum albumin level to grams per liter, multiply by 10.
aRace and ethnicity were self-identified. Minoritized racial and ethnic groups included African American or Black, Asian, Hispanic or Latino, and other (including Alaskan Indian or American Indian, Hawaiian Native, declined to answer, and not recorded).

