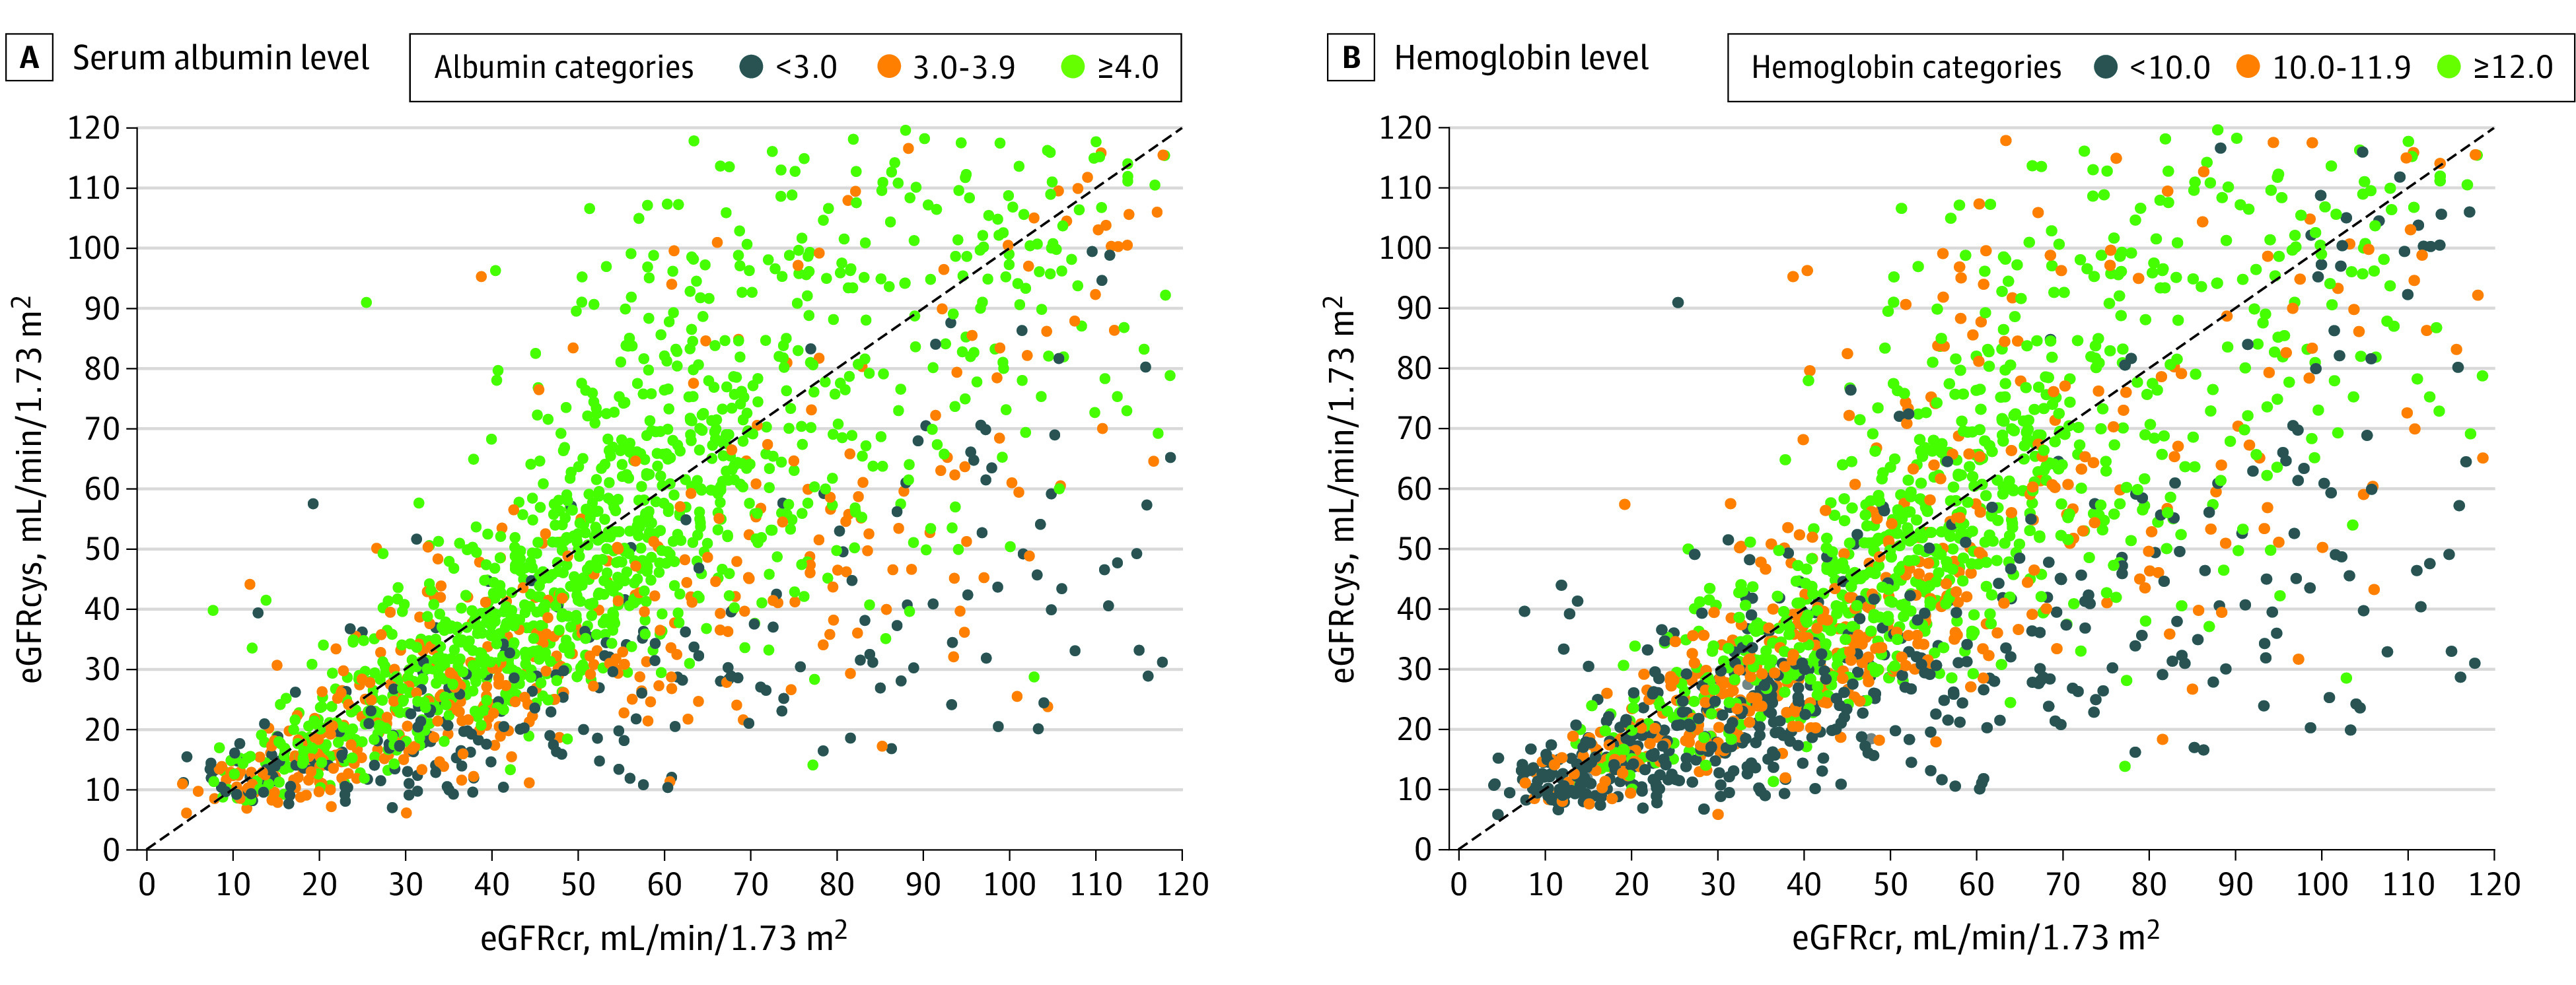
Figure 2. Scatterplots of Serum Creatinine–Based Estimated Glomerular Filtration Rate (eGFRcr) and Cystatin C–Based eGFR (eGFRcys) by Serum Albumin and Hemoglobin Levels.

The identity line (line of equality) is shown in black.

The identity line (line of equality) is shown in black.