
Figure A.24.
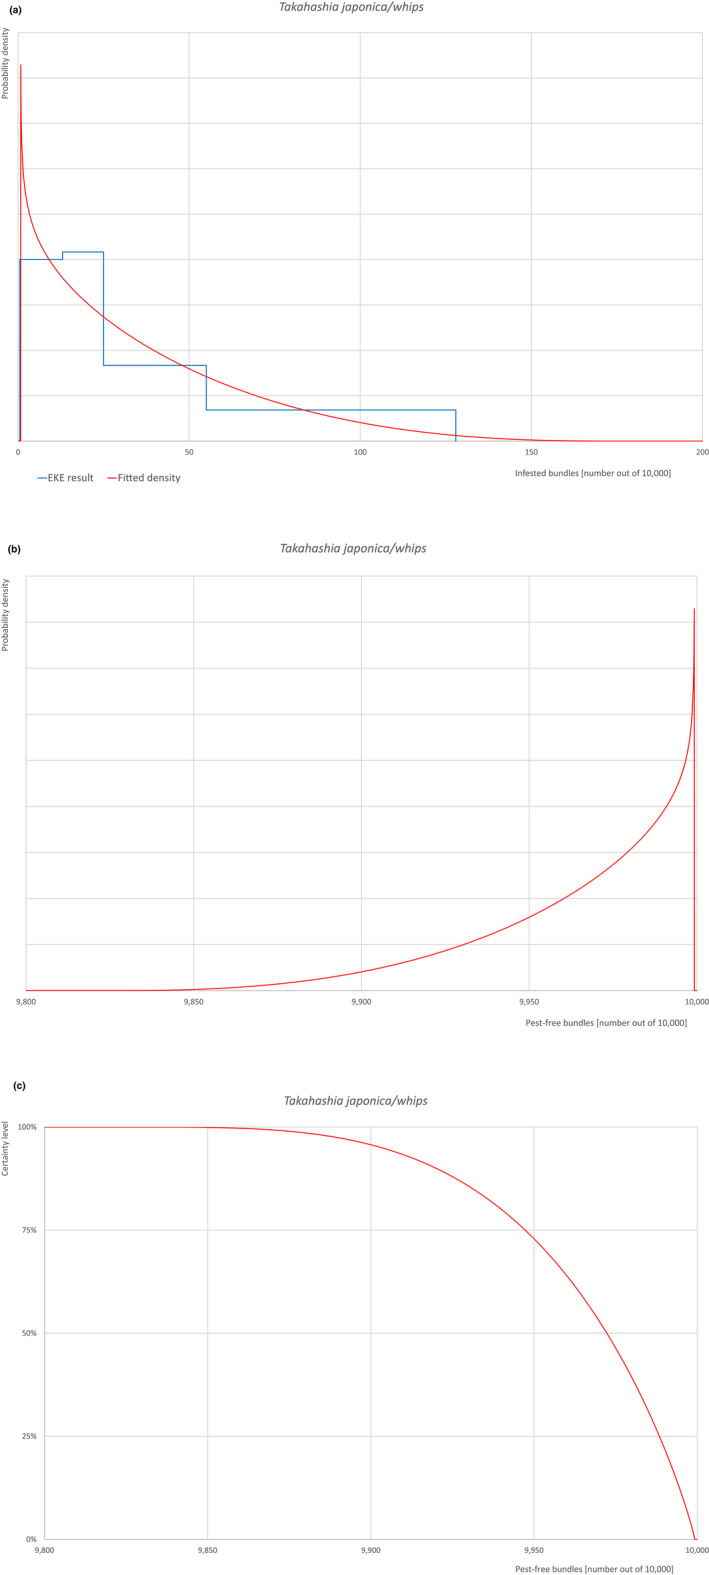
(a) Elicited uncertainty of pest infestation per 10,000 bundles (histogram in blue–vertical blue line indicates the elicited percentile in the following order: 1%, 25%, 50%, 75%, 99%) and distributional fit (red line); (b) uncertainty of the proportion of pest‐free bundles per 10,000 (i.e. = 1 – pest infestation proportion expressed as percentage); (c) descending uncertainty distribution function of pest infestation per 10,000 bundles