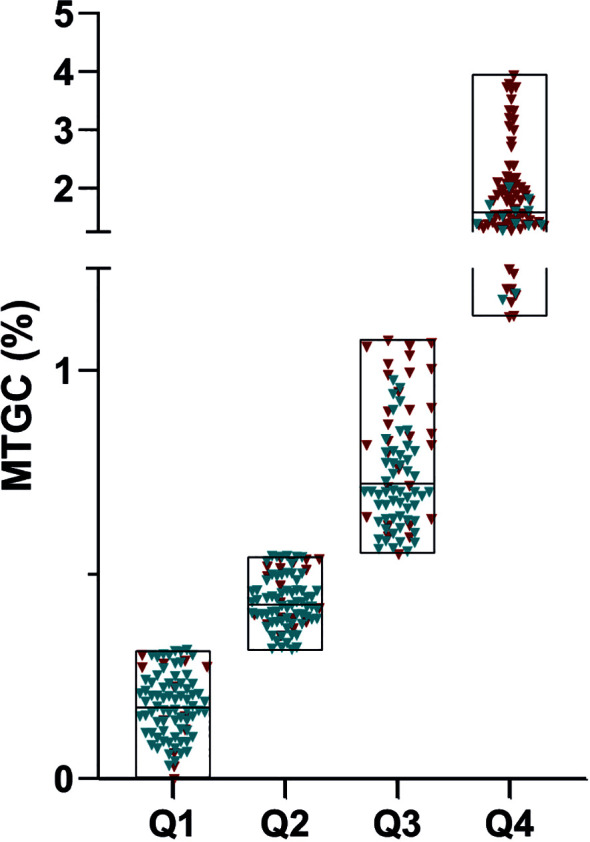
Figure 2.

Classification of the population based on myocardial triglyceride content quartile. Q1 (n=84):0.001% to 0.314%; Q2 (n=86): 0.314% to 0.543%; Q3 (n=84): 0.543% to 1.090%; Q4(n=84): 1.090% to 3.955%;X-axis represented the median of myocardial triglyceride content divided into quartiles; Healthy subjects are represented in blue and subjects living with T2D and/or obesity are represented in red.
