Figure 3.

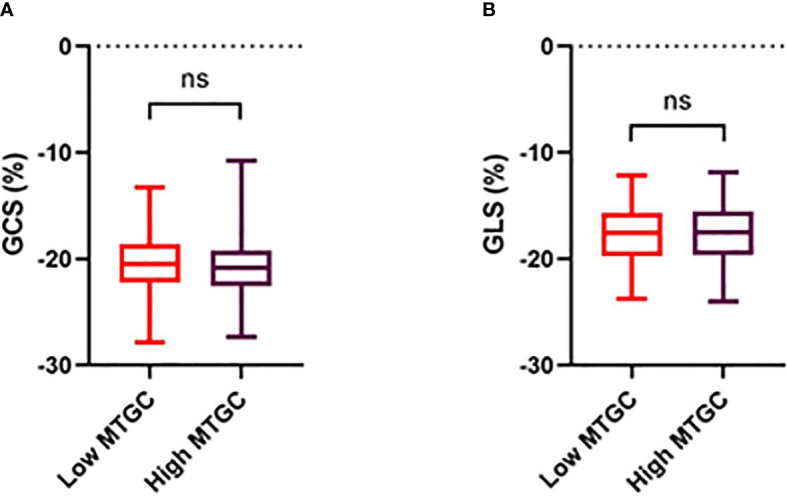
Comparison of circumferential (A) and longitudinal (B) strain between high and low MTGC subgroups. GCS, global peak systolic circumferential strain; GLS, global peak systolic longitudinal strain; ns, non significant.

Comparison of circumferential (A) and longitudinal (B) strain between high and low MTGC subgroups. GCS, global peak systolic circumferential strain; GLS, global peak systolic longitudinal strain; ns, non significant.