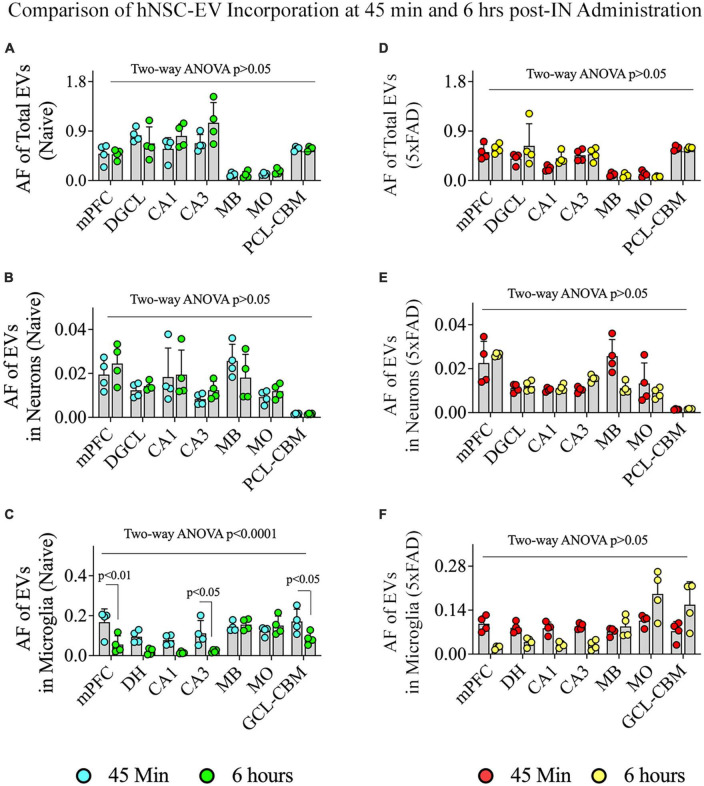
FIGURE 11.
Comparison of the incorporation of hiPSC-NSC-EVs in neurons and microglia across different regions of the forebrain, midbrain, and hindbrain between 45 min and 6 h post-intranasal administration in naïve and 5xFAD mice. The bar charts (A–C) compare the area fraction (AF) of total hiPSC-NSC-EVs (A) and mean AF of hiPSC-NSC-EVs within neurons (B) and microglia (C) in naïve mice between 45 min and 6 h post-intranasal administration for each chosen brain region. The bar charts (D–F) compare the area fraction (AF) of total hiPSC-NSC-EVs (D) and mean AF of hiPSC-NSC-EVs within neurons (E) and microglia (F) in 5xFAD mice between 45 min and 6 h post-intranasal administration for each chosen brain region. DGCL, dentate granule cell layer; DH, dentate hilus; GCL-CBM, granule cell layer of cerebellum; MB, midbrain; MO, medulla oblongata; mPFC, medial prefrontal cortex; PCL-CBM, Purkinje cell layer of cerebellum.

