FIGURE 8.
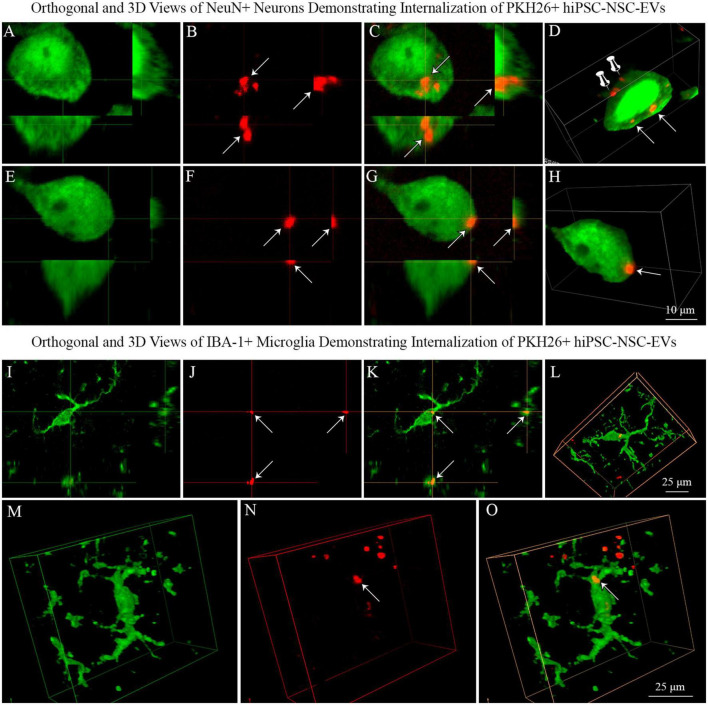
Neurons and microglia internalized PKH26 labeled hiPSC-NSC-EVs in 5xFAD mouse brain. Images (A–C,E–G) show orthogonal views of NeuN + neurons, demonstrating the internalization of PKH26 + hiPSC-NSC-EVs [arrows in panels (A–C)] or the partial entry of PKH26 + hiPSC-NSC-EVs into the cytoplasm of neurons [arrows in panel (E–G)]. Images (D,H) show 3-dimensional (3D) views of neurons shown in panels (A–C,E–G), respectively. The neuron in panel (D) displays EVs incorporated into the cytoplasm (indicated by arrows) and EVs attached to the surface of the plasma membrane (indicated by thumb tacks). Scale bar, 10 μm. Images (I–K) show orthogonal views of IBA-1 + microglia exhibiting the internalization of PKH26 + hiPSC-NSC-EVs (arrows), whereas images (L–O) are 3-D views of microglia with PKH26 + hiPSC-NSC-EVs. Scale bar, 25 μm.

