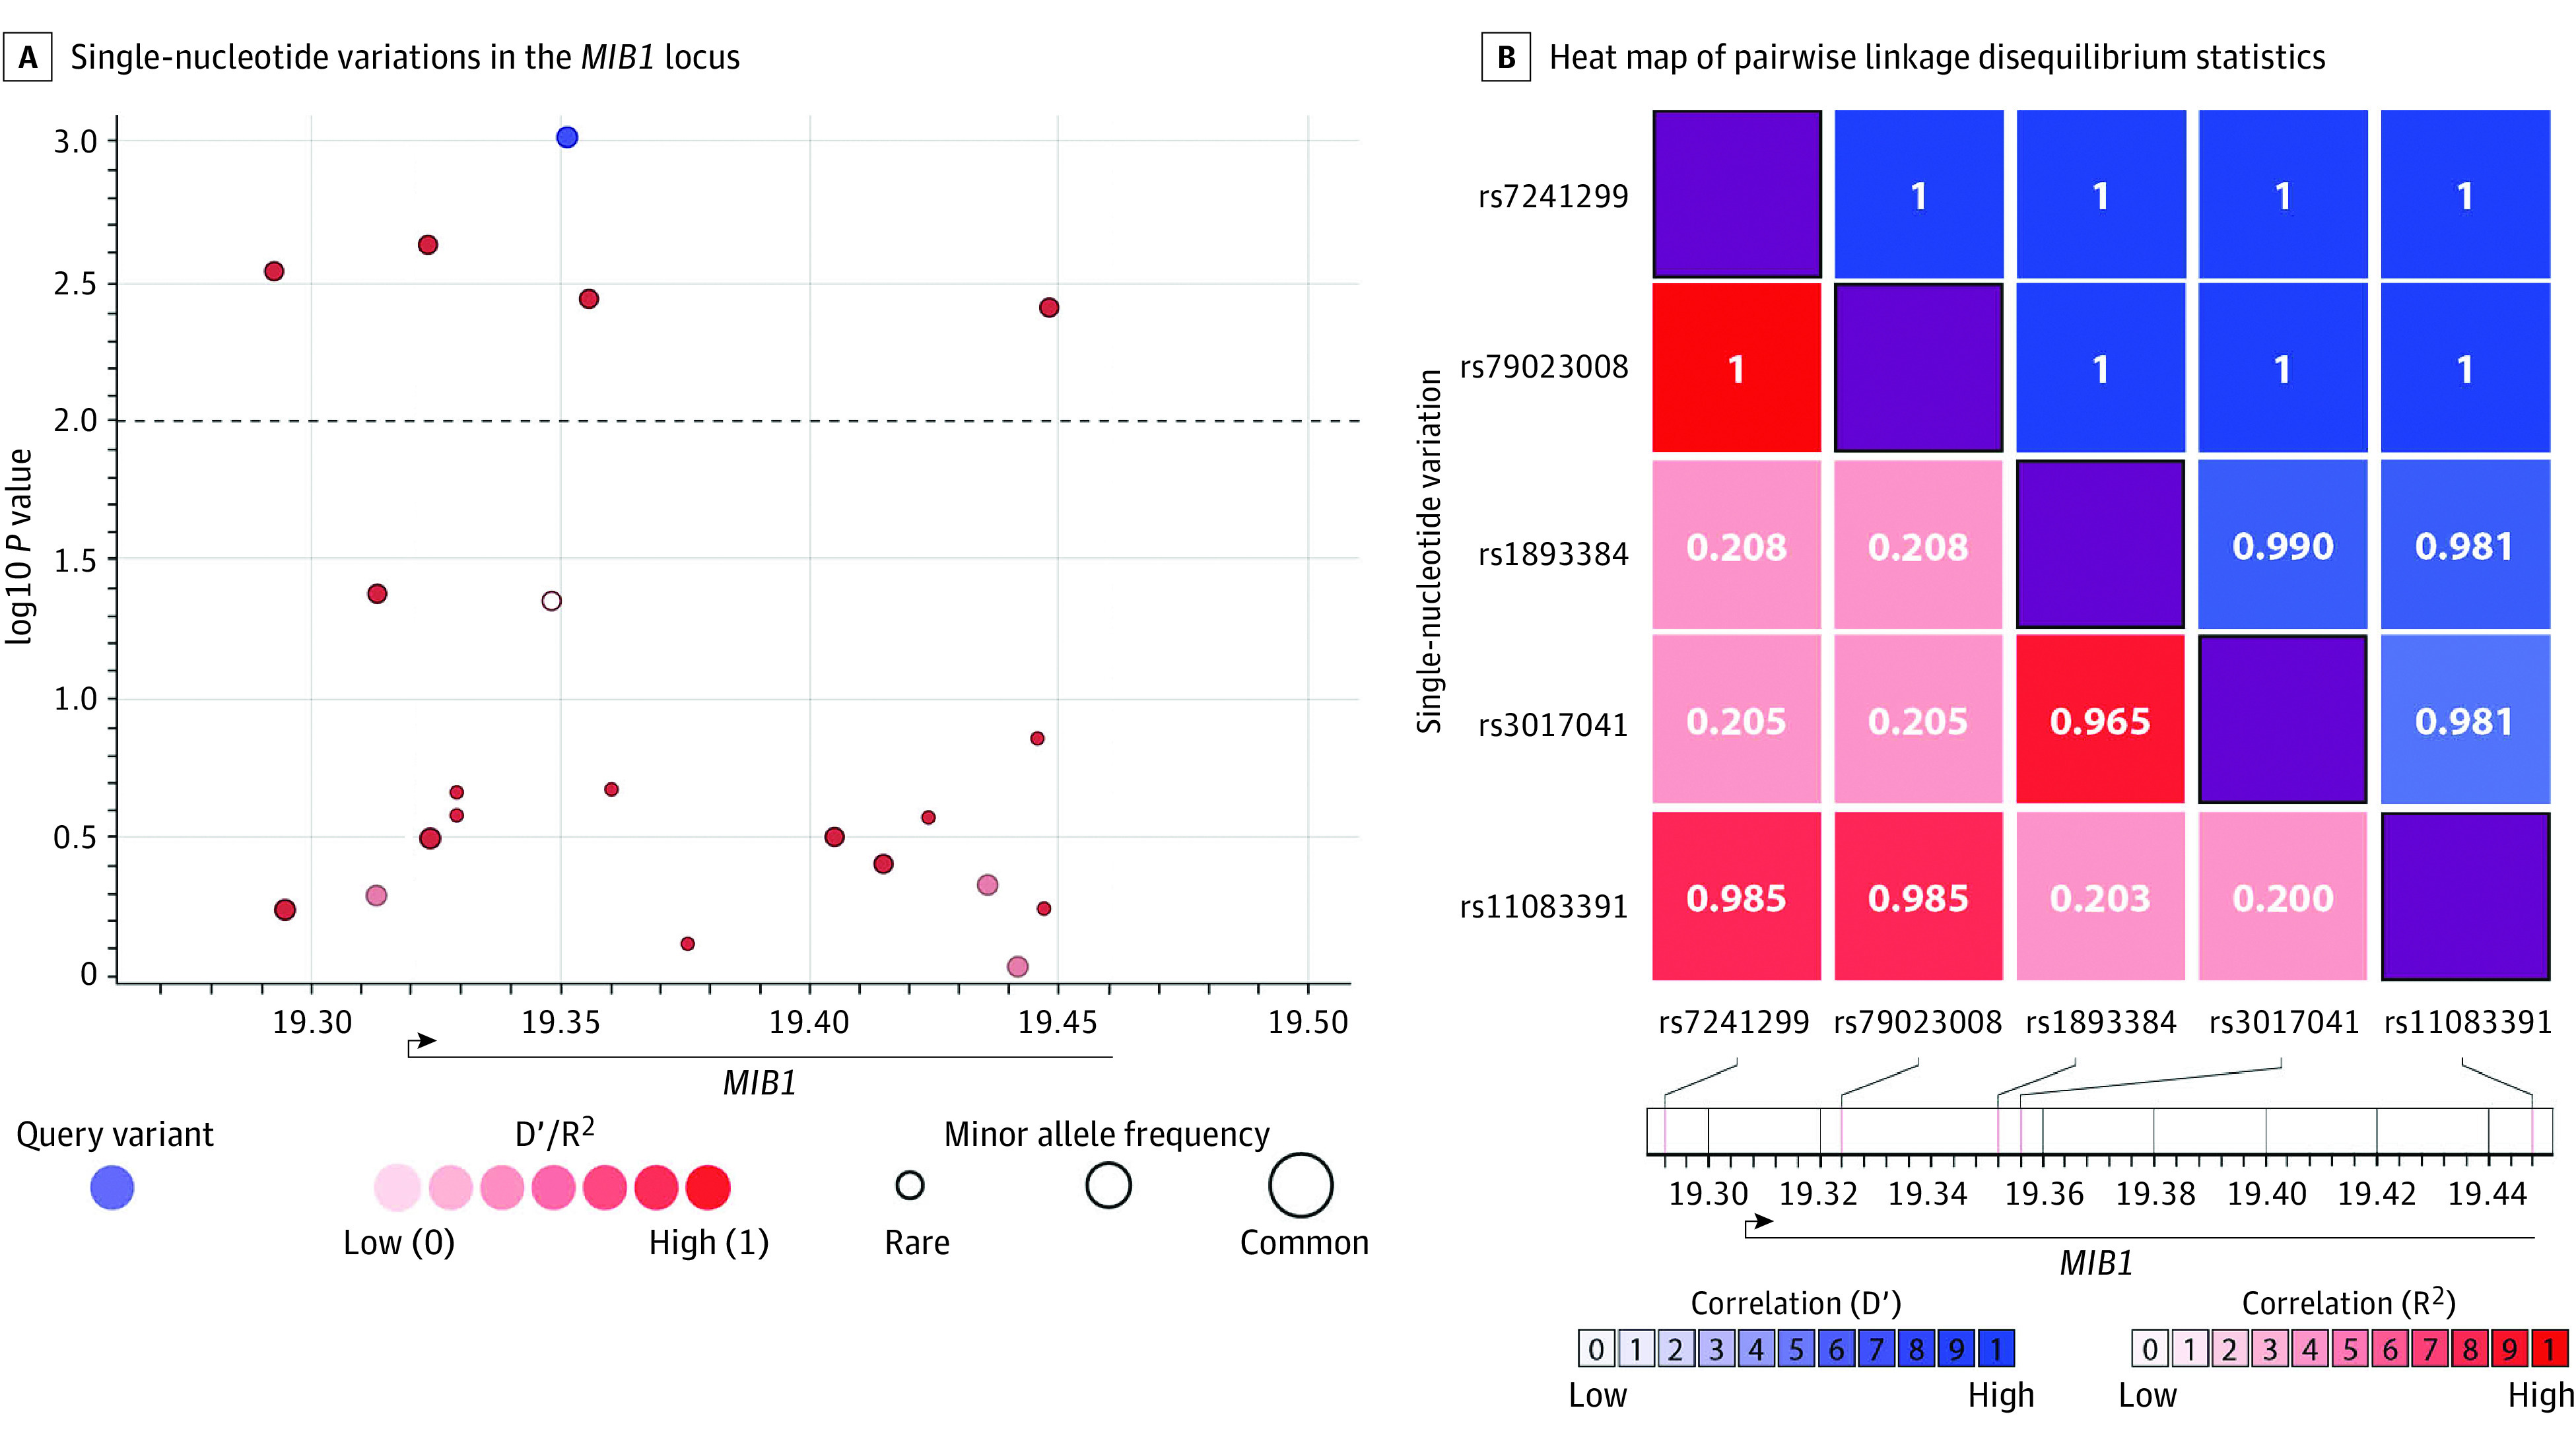
Figure 2. MIB1 Common Single-Nucleotide Variations (SNVs) Associated With Bicuspid Aortic Valve (BAV).

A, SNVs in the MIB1 locus. The x-axis represents the chromosomal coordinates; the y-axis represents the log10 P value (left) and the combined recombination rate from HapMap (right). The locus spans 166 Kb from chr18:19 284 918 to chr18:19 450 912 in GRCh37/hg19. Each point represents an SNV and is colored on the basis of D′ in relation to the most significant SNV, colored in blue. The dashed horizontal line marks the critical P value of .01, which was set by the false discovery rate multiple comparisons analysis.44 B, A heat map of pairwise linkage disequilibrium statistics for the statistically significant SNVs. The x and y dimensions represent the 5 significant SNVs identified, demonstrating linkage disequilibrium′ approaching 1 for all 5, implying high linkage disequilibrium, modified after being created by LDlink.31
