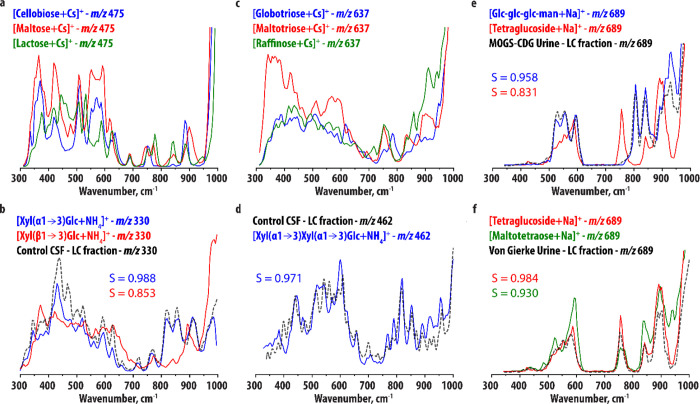
Figure 3.
(a, b) Comparison of the experimental IR spectra of (a) [M+Cs]+ ions of d-cellobiose, d-maltose, and d-lactose and (b) [M+NH4]+ ions of Xyl(α1→3)Glc and Xyl(β1→3)Glc. Panel (b) compares the IR spectrum of the m/z 330 ion ([M+NH4]+) detected in the HILIC-MS analysis of a CSF sample (black trace) to the two reference spectra. (c) Comparison of the experimental IR spectra of the [M + Cs]+ ions of d-globotriose (blue), d-maltotriose (red), and d-raffinose (green). (d) IR spectrum of the m/z 462 ion ([M+NH4]+) detected in the HILIC-MS analysis of a CSF sample (black trace) in comparison to the experimental IR spectrum of the [M+NH4]+ ion of Xyl(α1→3) Xyl(α1→3)Glc (blue trace). (e) IR spectrum of the m/z 689 ion ([M+Na]+) detected in the HILIC-MS analysis of a urine sample of a MOGS-CDG patient (black trace) in comparison to the experimental IR spectra of the [M+Na]+ ions of Glc-Glc-Glc-Man (blue trace) and d-tetraglucoside (red). (f) IR spectrum of the m/z 689 ion ([M+Na]+) detected in the HILIC-MS analysis of a urine sample of a Von Gierke disease patient (black trace) in comparison to the experimental IR spectrum of the [M+Na]+ ions of d-tetraglucoside (red) and d-maltotetraose (green).

