
Fig. 1.
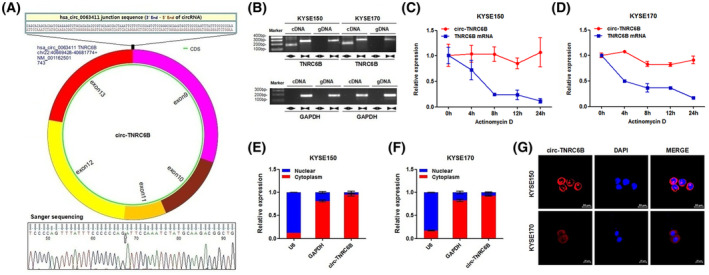
Characterization of circ‐TNRC6B in ESCC cells. (A) Schematic diagram of the cyclization of circ‐TNRC6B (circBase ID: hsa_circ_0063411) based on circBase database and circprimer 2.0 software. The back‐spliced junction sequences of circ‐TNRC6B were analyzed by CircInteractome database and verified by Sanger sequencing with divergent primers. (B) The existence of circ‐TNRC6B was validated in KYSE150 and KYSE170 cells by RT‐PCR. Divergent primers amplified circ‐TNRC6B in cDNA samples but not gDNA samples, while convergent primers amplified TNRC6B linear transcript in both cDNA and gDNA samples. GAPDH was selected as the reference control group (n = 2). (C, D) The relative expression levels of circ‐TNRC6B and TNRC6B mRNA were detected by qRT‐PCR after treatment with Actinomycin D in KYSE150 and KYSE170 cells at the indicated time points. Data are represented as mean ± SD (n = 2). (E, F) The cellular localization of circ‐TNRC6B was evaluated by nuclear and cytoplasmic fractionation assay in KYSE150 and KYSE170 cells. U6 and GAPDH were selected as nuclear and cytoplasmic control groups, respectively. Data are represented as mean ± SD (n = 2). (G) The cellular localization of circ‐TNRC6B was evaluated by FISH analysis in KYSE150 and KYSE170 cells (n = 3). Nuclei were stained with DAPI solution. Scale bar: 20 μm.