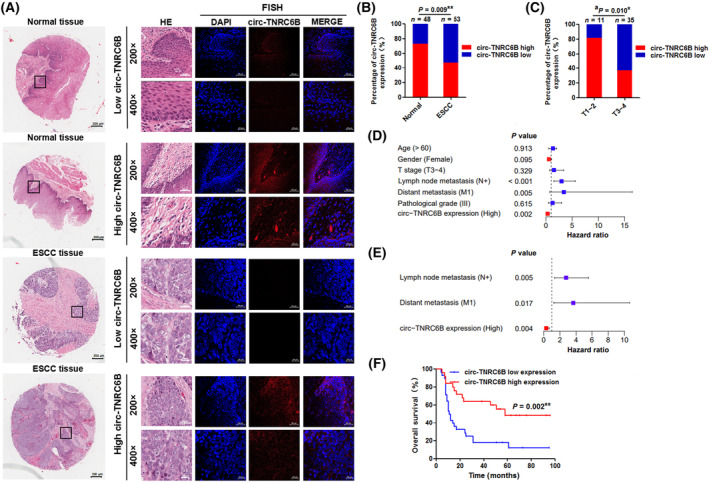
Fig. 2.

circ‐TNRC6B is downregulated in ESCC tissues and its low expression predicts poor prognosis in ESCC patients. (A) The representative images of circ‐TNRC6B expression in ESCC tissues and adjacent normal tissues by FISH assay (n = 3). Scale bar: 200 μm (whole tissue image), 50 μm (200× image), and 20 μm (400× image). (B) The percentage of circ‐TNRC6B expression in 53 ESCC tissues and 48 adjacent normal tissues. P‐values were determined by chi‐squared test. (C) The percentage of T stage in 25 ESCC tissues with circ‐TNRC6B high expression and 28 ESCC tissues with circ‐TNRC6B low expression. P‐values were determined by chi‐squared test. (D, E) Univariate and multivariate Cox regression analyses of prognostic factors for ESCC patients. The bars indicate 95% CI. (F) Kaplan–Meier curve for OS rate according to circ‐TNRC6B expression, n = 25 (circ‐TNRC6B high expression), 28 (circ‐TNRC6B low expression). Survival analyses were performed by log‐rank test. *P < 0.05, **P < 0.01. aNumbers do not equal to the total number due to missing data.
