
Fig. 5.
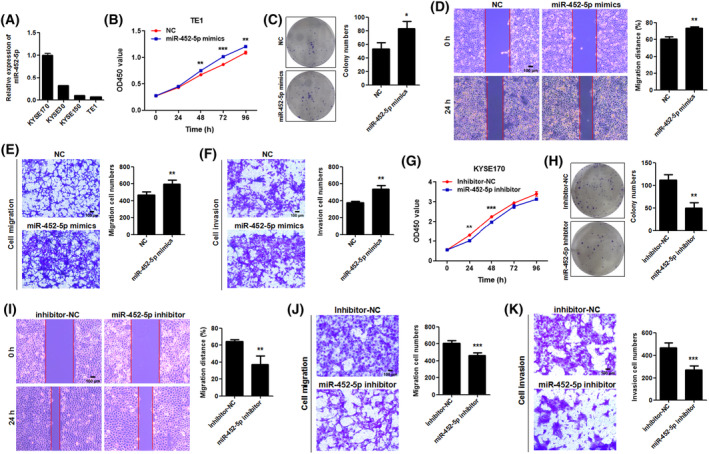
miR‐452‐5p promotes the proliferation, migration, and invasion abilities of ESCC cells. (A) The relative expression level of miR‐452‐5p in four ESCC cell lines was examined by qRT‐PCR (n = 2). Data are represented as mean ± SD. (B, C) The proliferative and clonogenic ability of TE1 cells after exogenous miR‐452‐5p mimics transfection was detected by CCK‐8 (n = 4, P‐values were determined by two‐way ANOVA) and colony formation assay (n = 3, P‐values were determined by Mann–Whitney U‐test). NC: negative control of miRNA mimics. Data are represented as mean ± SD. (D, E) The migration ability of TE1 cells after exogenous miR‐452‐5p mimics transfection was detected by wound healing and transwell migration assay. Data are represented as mean ± SD (n = 3, P‐values were determined by Mann–Whitney U‐test). Scale bar: 100 μm. (F) The invasion ability of TE1 cells after exogenous miR‐452‐5p mimics transfection was detected by transwell invasion assay. Data are represented as mean ± SD (n = 3, P‐values were determined by Mann–Whitney U‐test). Scale bar: 100 μm. (G, H) The proliferative and clonogenic ability of KYSE170 cells after miR‐452‐5p inhibitor transfection was detected by CCK‐8 (n = 4, P‐values were determined by two‐way ANOVA) and colony formation assay (n = 3, P‐values were determined by Mann–Whitney U‐test). Inhibitor NC: negative control of miRNA inhibitor. Data are represented as mean ± SD. (I, J) The migration ability of KYSE170 cells after miR‐452‐5p inhibitor transfection was detected by wound‐healing and transwell migration assay. Data are represented as mean ± SD (n = 3, P‐values were determined by Mann–Whitney U‐test). Scale bar: 100 μm. (K) The invasion ability of KYSE170 cells after miR‐452‐5p inhibitor transfection was detected by transwell invasion assay. Data are represented as mean ± SD (n = 3, P‐values were determined by Mann–Whitney U‐test). Scale bar: 100 μm. *P < 0.05, **P < 0.01, ***P < 0.001.