
Fig. 7.
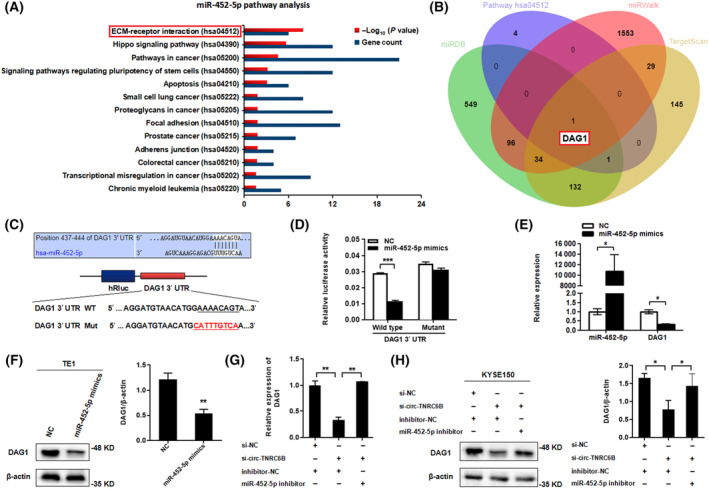
circ‐TNRC6B inhibits the proliferation and invasion of ESCC cells by regulating miR‐452‐5p/DAG1 axis. (A) KEGG pathway analysis of miR‐452‐5p was predicted through TarBase database by DIANA TOOLS. (B) Venn diagram showing the intersection of potential downstream mRNA targets of miR‐452‐5p predicted by Targetscan, miRWalk, miRDB databases, and the enriched gene of ECM‐receptor interaction pathway. (C) The predicted hsa‐miR‐452‐5p binding site in DAG1 3′UTR by Targetscan database, and a schematic representation of the DAG1 3′UTR wild‐type or mutant reporter constructs. (D) Dual‐luciferase reporter assay was performed to detect the luciferase activity of DAG1 3′UTR wild‐type or mutant reporter constructs co‐transfected with miR‐452‐5p mimics or negative control vector. Data are represented as mean ± SD (n = 2, P‐values were determined by Mann–Whitney U‐test). (E, F) DAG1 mRNA and protein levels after miR‐452‐5p overexpression in TE1 cells were detected by qRT‐PCR (n = 2, P‐values were determined by Mann–Whitney U‐test) and western blotting assay (n = 3, P‐values were determined by Mann–Whitney U‐test). Data are represented as mean ± SD. (G, H) DAG1 mRNA and protein levels after silencing circ‐TNRC6B alone or simultaneous knockdown of miR‐452‐5p in KYSE150 cells were detected by qRT‐PCR (n = 2, P‐values were determined by one‐way ANOVA) and western blotting assay (n = 3, P‐values were determined by one‐way ANOVA). Data are represented as mean ± SD. *P < 0.05, **P < 0.01, ***P < 0.001.