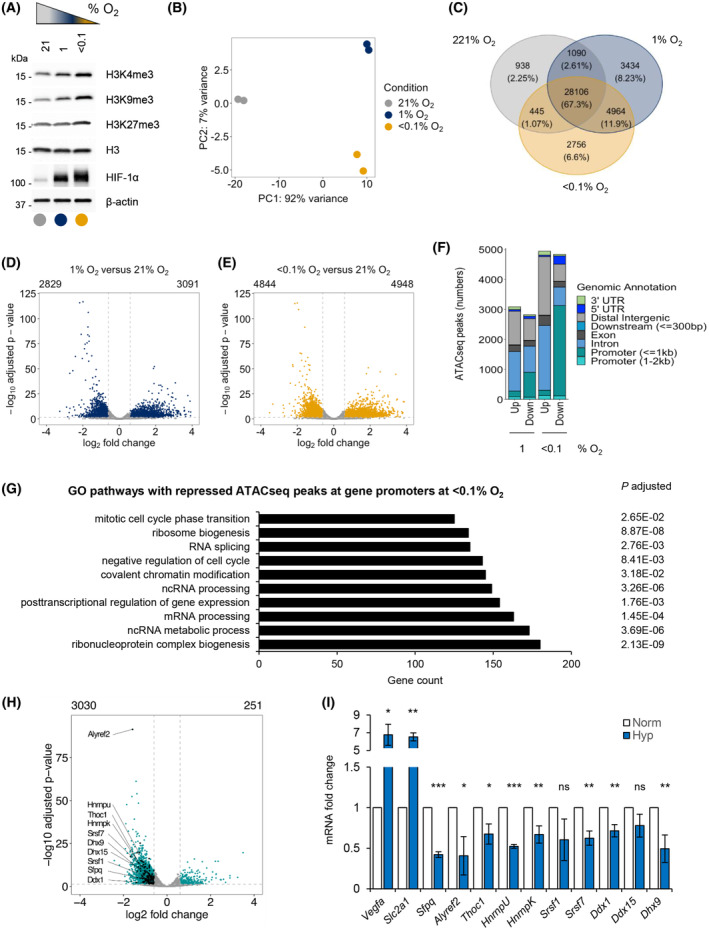
Fig. 1.

Oxygen‐dependent chromatin alterations lead to a loss of promoter accessibility of numerous pathways, including RNA processing factors. (A) GL261 cell line was exposed to 21%, 1% or < 0.1% O2 for 16 h and subjected to western blotting for the histone modifications indicated. HIF‐1α was used as a hypoxia control. A representative western blot of three biological replicates is shown. (B) GL261 cells were exposed to 16 h of normoxia (21% O2) or two conditions of hypoxia (1% and < 0.1% O2). Samples were fixed and ATACseq carried out. Principal component analysis of ATACseq peaks for the three oxygen tensions is shown. (C) Venn diagram showing hypoxia specific or common ATACseq peaks detected in all oxygen conditions from (B). The percentage of peaks in the total amount of peaks is shown for each condition. (D) A volcano plot showing differentially altered ATACseq peaks in 1% O2 versus 21% O2. Statistically significant peaks with FDR < 0.05 and |log2 fold change| ≥ 0.6 are marked in blue. (E) A volcano plot showing differentially altered ATACseq peaks in < 0.1% O2 versus 21% O2. Statistically significant peaks with FDR < 0.05 and |log2 fold change| ≥ 0.6 are marked in yellow. (F) Differentially regulated ATACseq peaks from parts (D and E) annotated to distinct genomic regions at 1% or < 0.1% O2 in relation to normoxic control. ‘Up’ or ‘Down’ marks significantly increased or decreased peaks, respectively, for each hypoxic condition in relation to normoxia. (G) Top 10 Gene Ontology (GO) pathways (based on the highest gene count) associated with genes that had decreased ATACseq peaks at their promoters. Adjusted P value indicates statistical significance for each pathway shown. (H) A volcano plot showing differentially regulated ATACseq peaks at the gene promoters in cells treated with < 0.1% O2, with significantly up‐regulated 251 peaks and 3030 downregulated peaks. Statistically significant peak changes were annotated with green dots (FDR < 0.05 and |log2 fold change| ≥ 0.6). Black dots mark all significantly downregulated peaks for gene promoters of genes from the GO pathway ‘RNA splicing’ (GO:0008380) and some names of these genes are indicated (full list in Table S4). (I) qPCR validation of hypoxia‐dependent repression of splicing factors indicated in (H) in GL261 cell line treated for 16 h at < 0.1% O2. Mean ± standard deviation expression is shown from three biological repeats. Vegfa and Slc2a1 were used as positive hypoxia‐inducible controls. Statistical significance was calculated with two‐tailed Student's t‐test for each gene expression tested in hypoxia compared to normoxia (*P < 0.05, **P < 0.01, ***P < 0.001, ns, nonsignificant).
