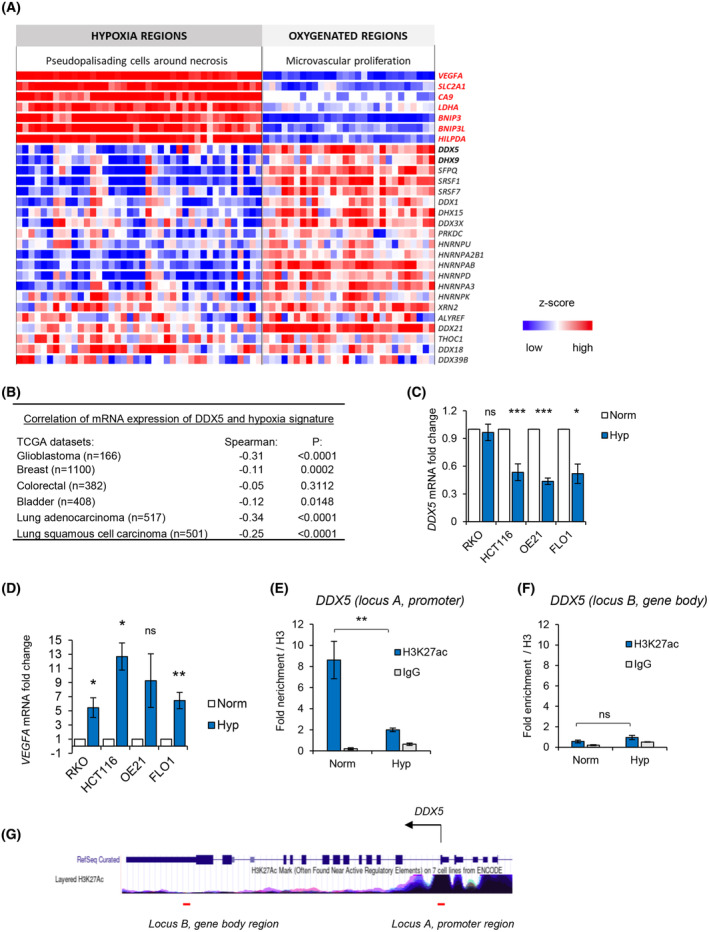
Fig. 2.

Loss of chromatin accessibility in hypoxia is mirrored by gene expression changes, including the loss of mRNA expression of DDX5. (A) A heatmap showing a z‐score expression of hypoxia markers as well as RNA processing factors in two anatomical regions of glioblastoma, including ‘microvascular proliferation’ region and ‘pseudopalisading cells around necrosis.’ Data was accessed via IvyGAP Glioblastoma project at http://glioblastoma.alleninstitute.org/ and selected genes are shown. Each column represents a separate sample for a given region and rows show expression of particular genes in these samples. (B) Expression of DDX5 (mRNA) was correlated with the hypoxia metagene signature in the indicated TCGA cancer patient cohorts: breast invasive carcinoma, colorectal adenocarcinoma, glioblastoma, bladder urothelial carcinoma, lung adenocarcinoma, and lung squamous cell carcinoma. The numbers of patient samples are shown in brackets. Spearman's rank correlation coefficient and P values are shown for the Log10 median expression of DDX5 and hypoxic signature. (C, D) The indicated cell lines were exposed to hypoxia (< 0.1% O2) for 18 h. Expression of DDX5 (C) and VEGFA (D) was determined by qPCR and normalized to 18S. Statistical significance was calculated with two‐tailed Student's t‐test for each cell line based on three biological replicates (*P < 0.05, **P < 0.01, ***P < 0.001, ns, nonsignificant). (E, F) HCT116 cells were exposed to 16 h of hypoxia (< 0.1% O2) followed by chromatin immunoprecipitation with H3, H3K27ac and IgG antibodies and qPCR analysis. Fold enrichment for H3K27ac and IgG normalized to total H3 enrichment is shown as mean ± standard deviation from three independent experiments. Statistical significance was calculated with two‐tailed Student's t‐test (**P < 0.01, ns, nonsignificant). (G) The DDX5 locus taken from the UCSC genome browser (https://genome.ucsc.edu/) at the human GRCh37/hg19 genome assembly is shown with a track underneath showing the layered H3K27ac profile across the DDX5 gene. Red lines underneath the track indicate the binding site of ChIP‐qPCR primers amplifying the promoter region (locus A) and gene body region (locus B) used in ChIP‐qPCR analysis in (E and F).
