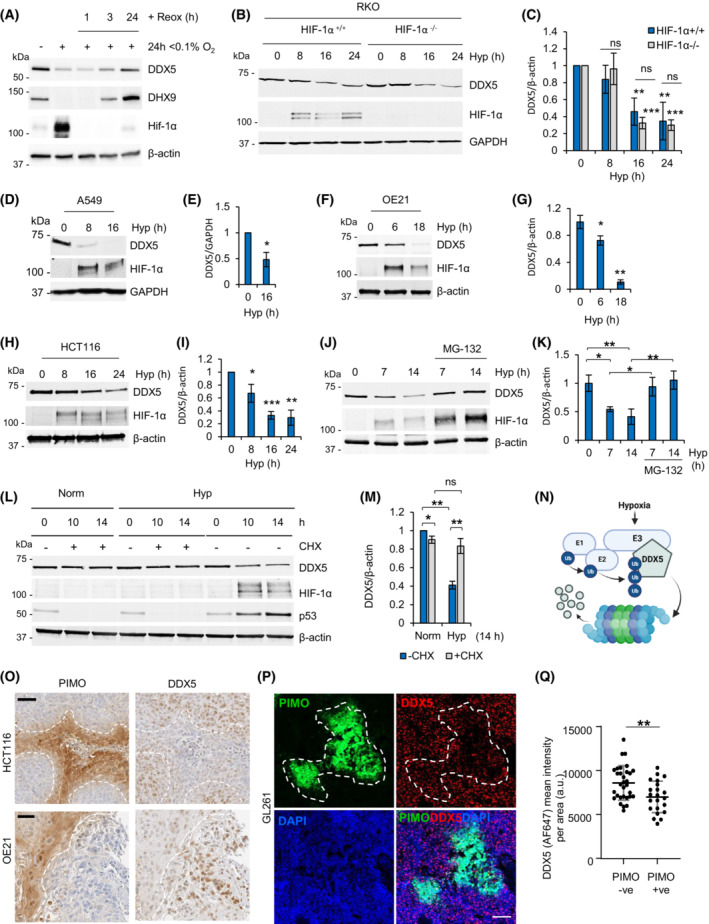
Fig. 3.

Hypoxia leads to the active repression of DDX5 protein. (A) GL261 cells were exposed to hypoxia (Hyp, 0.1% O2) for 24 h followed by reoxygenation (to 21% O2) for the indicated times following hypoxia. Western blotting was carried out for the antibodies shown (representative of three independent experiments). (B, C) RKOHIF‐1α+/+ and RKOHIF‐1α−/− were exposed to hypoxia (< 0.1% O2) for the times indicated and subjected to western blotting with the antibodies shown (representative of at least three biological replicates). Densitometry is shown in part (C). (D–I) A549, OE21, and HCT116 cell lines were exposed to hypoxia (Hyp, 0.1% O2) for the times indicated followed by western blotting for DDX5 as well as HIF‐1α (hypoxic marker) and β‐actin (loading control). Representative blots from at least three independent experiments are shown. Densitometry for the biological replicates showing hypoxia‐dependent repression of DDX5 is shown. (J, K) HCT116 cells were exposed to hypoxia (Hyp, < 0.1% O2) and MG‐132 (5 μm) as indicated and western blotting was carried out with the antibodies shown. Densitometry for three biological replicates is shown in part (K). (L, M) HCT116 cells were treated with 25 μg·mL−1 cycloheximide (CHX) in hypoxic (Hyp, < 0.1% O2) or normoxic (Norm, 21% O2) conditions for the times indicated and analyzed with western blotting. Densitometry for three biological replicates is shown in part (M). (N) A scheme showing hypothesis of hypoxia‐inducible degradation of DDX5 via proteasome. The scheme was drawn with BioRender.com. (O) Sequential sections from HCT116 and OE21 tumor xenografts using the cell lines indicated (HCT116 or OE21) were stained for hypoxia with antipimonidazole hyoxyprobe‐1 (PIMO) and DDX5 antibodies. Nuclei were counterstained with hematoxylin Scale bar = 50 μm. The outline of PIMO‐positive (brown) staining is shown by the dashed white line. (P) PFA‐fixed GL261 tumor xenografts were sectioned and subjected to immunofluorescent staining for hypoxia (PIMO) and DDX5. Nuclei were counterstained with DAPI. Scale bar = 100 μm. The outline of PIMO‐positive (FITC) staining is shown by the dashed white line. (Q) Mean fluorescence intensity ± standard deviation of DDX5 signal (labeled with Alexa Fluor‐647) in GL261 tumors from part (P) was measured in hypoxic (PIMO +ve) and normoxic (PIMO −ve) image areas using zen2 software (Zeiss). A total of 22 hypoxic areas and 31 normoxic areas were analyzed and two‐tailed nonparametric Mann–Whitney test shows statistical significance (P‐value 0.007, **).
