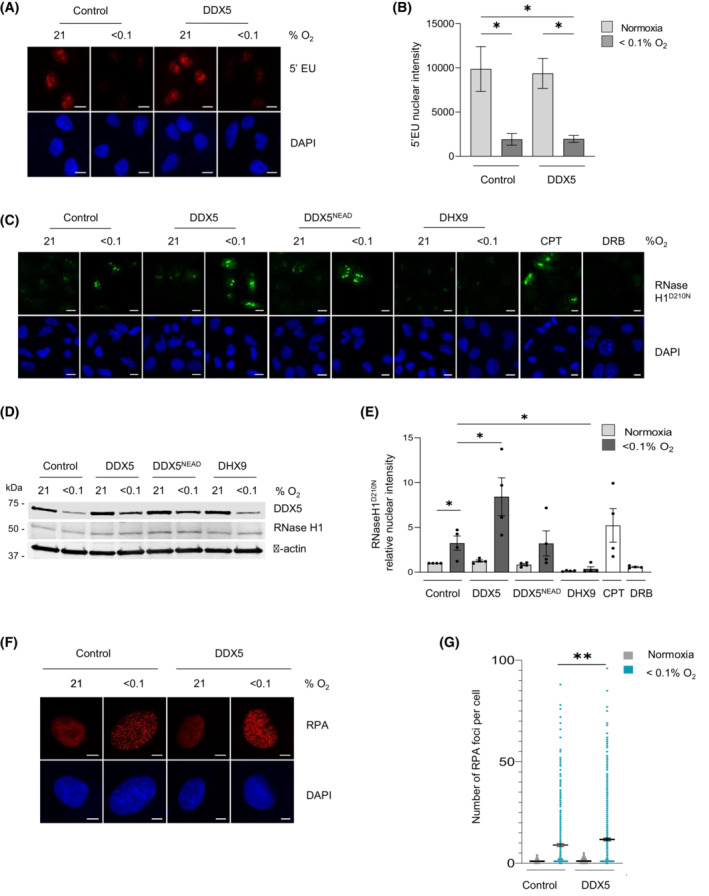
Fig. 4.

Rescuing DDX5 expression in hypoxia leads to accumulation of R‐loops. (A) A549 cells were transfected with myc‐tagged DDX5 or control vector and exposed to hypoxia (8 h) with 5'EU (0.5 mm) added for the final hour. Staining for 5'EU was then carried out. Representative images are shown (scale bar = 10 μm). 5'EU staining in red, DAPI (blue) shows the nucleus. (B) Nuclear Intensity of 5'EU staining from A was determined. Data represents the mean expression and SEM from three independent experiments. Statistical significance was calculated with an unpaired Student's t‐test for each indicated condition (*P < 0.05). (C) A549 cells were co‐transfected with RNase H1D210N together with myc‐tagged DDX5, myc‐tagged DDX5NEAD, or with DHX9 and exposed to hypoxia for 18 h. CPT (10 μm, 20 min) or DRB (100 μm, 1 h) were used as a positive and negative controls for R‐loops, respectively. Representative images for R‐loop visualization with V5‐RNase H1D210N fluorescence are shown (scale bar = 10 μm). V5 fluorescence is shown in green, DAPI (blue) shows the nucleus. (D) Western blot analysis confirms expression of DDX5 and RNase H1D210N across conditions shown in part (C). (E) Quantification of fluorescent intensity from part (C). A minimum of 100 cells were included per condition. Data represent the mean expression and SEM from four independent experiments. Statistical significance was determined with an unpaired Student's t‐test for each indicated condition (*P < 0.05). (F) A549 cells were transfected as indicated and staining for RPA foci was then carried out. Representative images are shown (scale bar = 10 μm). RPA staining in red, DAPI (blue) shows the nucleus. (G) Quantification of the number of foci per cell in part (F) was determined. Data represents the mean expression and SEM from three independent experiments, each dot represents a cell and a minimum of 100 cells were imaged per treatment. Statistical significance was calculated with an unpaired Student's t‐test for each indicated condition (**P < 0.01).
