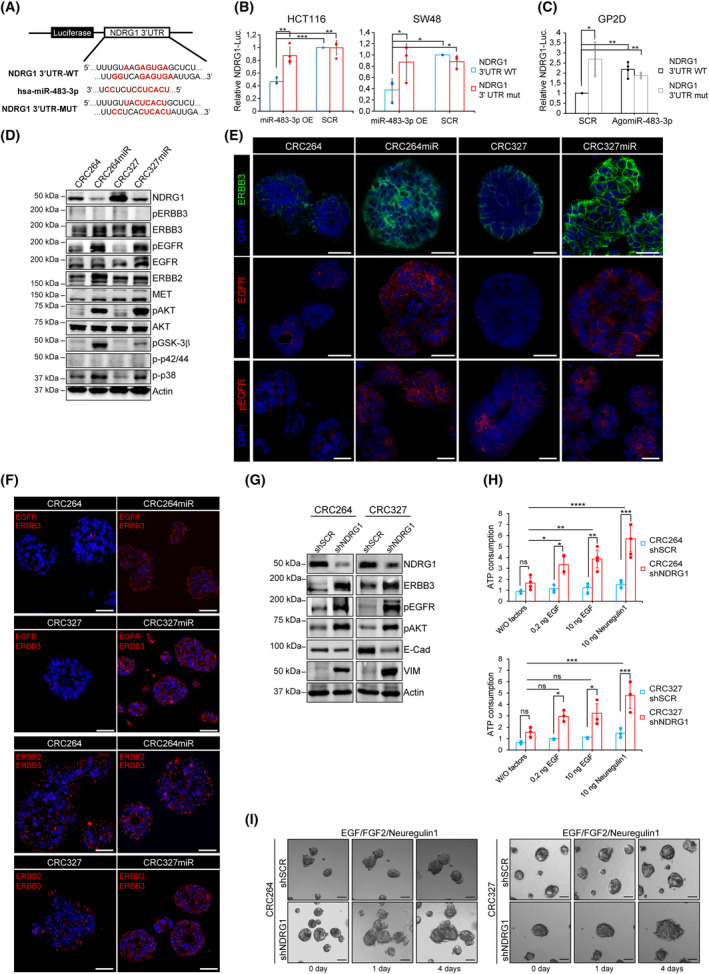
Fig. 3.

miRNA‐483‐3p targets the metastatic suppressor NDRG1, resulting in upregulation of EGFR family/AKT axis signaling. (A–C) Dual‐Luciferase miRNA target Assay. NDRG1‐3′UTR wt or mutated sequences were inserted downstream of the firefly luciferase gene, in Dual‐Luciferase miRNA target vectors; predicted miRNA‐483‐3p binding sites and relative mutations in 3'UTR are shown in red (A). HCT116 and SW48 (low endogenous miRNA‐483‐3p) were co‐transfected with Dual‐Luc vectors (NDRG1‐3'UTR WT: blue bars; or NDRG1‐3'UTR MUT: red bars) and with miRNA‐483‐3p (OE, overexpression) or miRNA‐483‐3p scrambled sequence (SCR) (B). GP2D (high endogenous miRNA‐483‐3p) were co‐transfected with Dual‐Luc vectors (NDRG1‐3'UTR WT: black bars; or NDRG1‐3'UTR MUT: gray bars) and AntagomiR‐483‐3p or scrambled sequence (SCR) (C). Bars represent Firefly vs. Renilla Luciferase (internal control) ratio. Signal ratio was normalized in each cell line vs. its NDRG1‐3'UTR + SCR control (error bars in (B and C) represent standard deviation; *, P < 0.05, **, P < 0.01; ***, P = 0.0001; n ≥ 3; Welch's t‐test). (D) Representative western blot of NDRG1, EGFR family receptors and downstream signal transducers in CRC264, CRC264miR, CRC327 and CRC327miR (n ≥ 3). pEGFR, phospho‐EGFR; pAKT, phospho‐AKT; pGSK‐3β(S9), phosphoSer9‐GSK3β; p‐p42/44, phospho‐p42/44; p‐p38, phospho‐p38. Densitometric analysis is shown in Fig. S3F (n ≥ 3). (E) Representative immunofluorescent stainings of ERBB3, and total and phosphorylated EGFR. Nuclei were counterstained with DAPI. Scale bar, 50 μm, (n ≥ 3). (F) Representative immunofluorescent stainings of Proximity ligation assay (PLA); red dots identify EGFR‐ERBB3 and ERBB2‐ERBB3 heterodimers (left). Scale bar, 50 μm. Quantification is shown in Fig. S3H (n = 3). (G) Representative western blot of NDRG1, EGFR family receptors, pAKT and EMT markers in CRC264shSCR, CRC264shNDRG1, CRC327shSCR and CRC327shNDRG1 (shSCR: control m‐colospheres transduced with scrambled shRNA; shNDRG1: transduced with shNDRG1). Densitometric analysis is shown in Fig. S3J (n ≥ 3). (H) Cell viability of CRC264shSCR, CRC264shNDRG1, CRC327shSCR and CRC327shNDRG1 m‐colospheres kept for 4 days in basal medium (without growth factors: W/O factors), or in basal medium with EGF (0.2 or 10 ng·mL−1) or neuregulin 1 (10 ng·mL−1). Bars: ATP consumption, fold change at day 4 vs. day 0 ± SEM (n > 3; ns, not significant; *, P < 0.05; **, P < 0.01; ***, P < 0.005; ****, P < 0.0001; one‐way ANOVA). (I) 3D‐spheroid invasion assay. CRC264shSCR, CRC264shNDRG1, CRC327shSCR and CRC327shNDRG1 m‐colospheres were embedded in a matrigel‐collagen type I matrix and their growth was monitored by time‐lapse microscopy at the indicated time points (n = 3). Scale bar, 50 μm. Quantitative morphometric analysis is shown in Fig. S3K.
