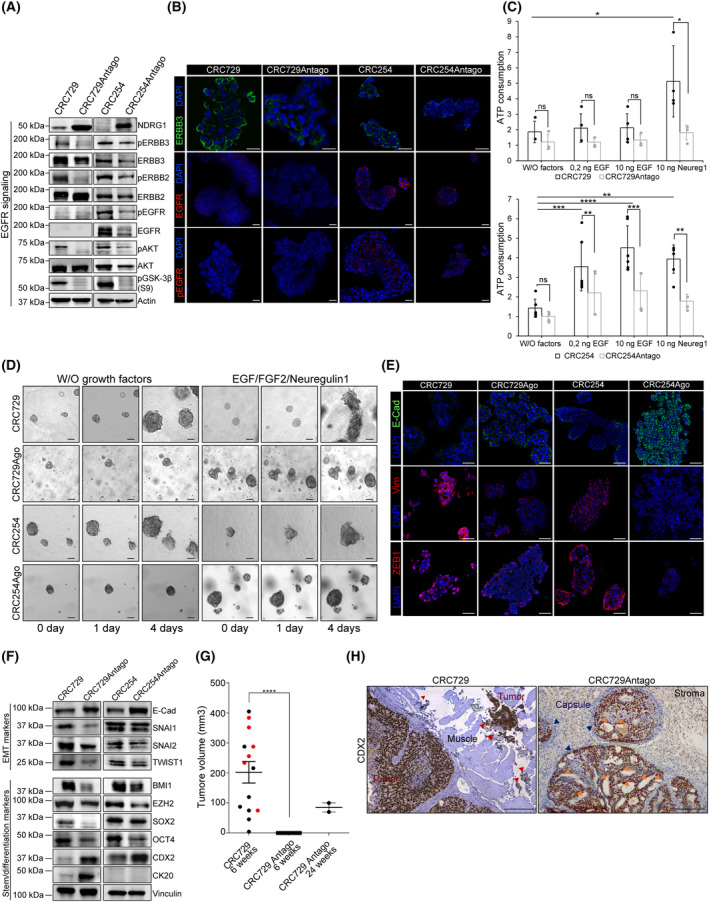
Fig. 5.

AntagomiRNA‐483‐3p reverts ERBB3 activity and inhibits tumorigenicity and invasion in m‐colospheres endogenously overexpressing miRNA‐483‐3p. (A) Representative western blot of NDRG1, EGFR family receptors and downstream signal transducers in CRC729, CRC254 and their counterparts transduced with antagomiRNA‐483‐3p (CRC729Antago and CRC254Antago). Densitometric analysis is shown in Fig. S5B (n = 3). (B) Representative immunofluorescent staining of ERBB3, EGFR, and phospho‐EGFR (pEGFR) in CRC729, CRC729Antago, CRC254 and CRC254Antago. Nuclei were counterstained with DAPI (n = 3). Scale bar, 50um. (C) Cell viability of CRC729, CRC729Antago, CRC254 and CRC254Antago m‐colospheres kept for 4 days in basal medium (without growth factors: W/O factors), or in basal medium with EGF (0.2 or 10 ng·mL−1) or neuregulin 1 (10 ng·mL−1). Bars: ATP consumption, fold change at day 4 vs. day 0 ± SEM (n > 7; ns, not significant; *, P < 0.05; **, P < 0.005; ***, P < 0.001; ****, P < 0.0001; one‐way ANOVA). (D) 3D‐spheroid invasion assay. CRC729, CRC729Antago, CRC254 and CRC254Antago m‐colospheres were embedded in a matrigel‐collagen type I matrix in the absence or in the presence of the indicated growth factors, and their growth was monitored by time‐lapse microscopy at the indicated time points Quantitative morphometric analysis is shown in Fig. S5C (n = 3). (E) Representative immunofluorescent staining of EMT markers E‐cadherin, vimentin and ZEB1 in CRC729, CRC729Antago, CRC254 and CRC254Antago. Nuclei were counterstained with DAPI (n = 3). Scale bar, 50 μm. (F) Representative western blot of EMT and colorectal stem/differentiation markers in CRC729, CRC729Antago, CRC254 and CRC254Antago. Densitometric analysis is shown in Fig. S5C (n = 3). (G) Tumor take and volume in mice subcutaneously transplanted with 105 CRC729 (n = 14) or CRC729Antago (n = 14) m‐colosphere cells, measured at 6 or 24 weeks after injection (****, P < 0.0001; one‐way ANOVA). (H) Representative immunohistochemistry with human CDX2 antibody of tumors as in (G) (n = 3). CRC729: red arrowheads indicate cell clusters invading muscles; CRC729Antago: blue arrowheads indicate the presence of a stromal capsule surrounding tumor areas; orange arrowheads: adenomatous areas. Scale bar, 0.2 mm.
