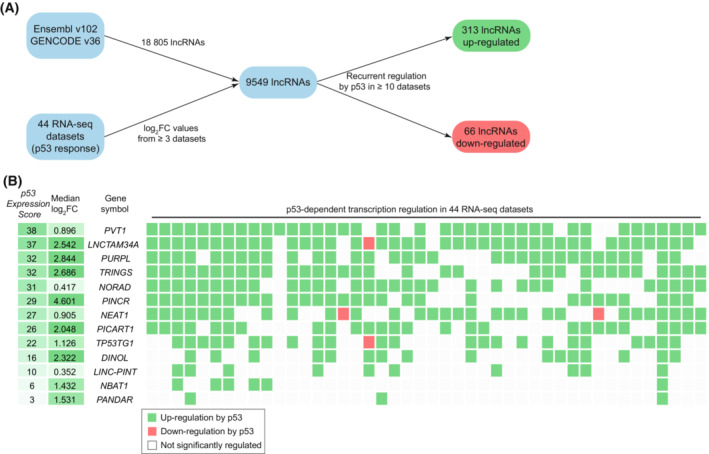
Fig. 1.

Identification of p53‐dependent lncRNA regulation. (A) Flow chart for the integration of 44 RNA‐seq datasets on p53‐dependent lncRNA regulation. Out of 18 805 lncRNAs listed in Ensembl v102/GENCODE v36, log2fold‐change (log2FC) values from at least three datasets were obtained for 9549 lncRNAs. Recurrent p53‐dependent regulation was specified by a p53 Expression Score (the number datasets with significant up‐regulation minus the number of datasets displaying significant down‐regulation by p53) ≥ 10 and ≤ −10 for up and down‐regulated lncRNAs, respectively. (B) The p53 Expression Score (RNA‐seq) and data from the underlying 44 individual RNA‐seq datasets, including the median log2fold‐change (log2FC; regardless of statistical significance), visualized for 13 selected lncRNAs known to be direct p53 targets. Green and red datapoints indicate significant up and down‐regulation, respectively, while white datapoints indicate no significant regulation by p53.
