Fig. 5.

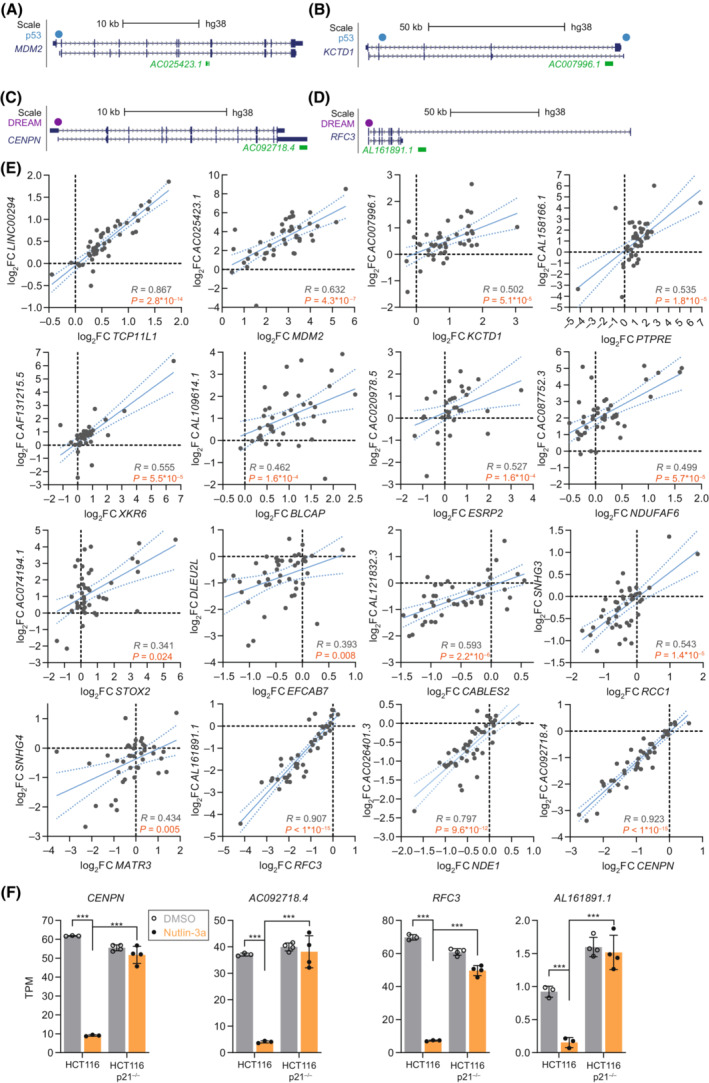
Nested lncRNAs potentially regulated by p53 through their host genes. Genomic loci of (A) AC025423.1 hosted by the p53 target MDM2, (B) AC007996.1 hosted by the p53 target KCTD1, (C) AC092718.4 hosted by the DREAM target CENPN, and (D) AL161891.1 hosted by the DREAM target RFC3. (A–D) Two representative host gene transcripts are displayed in dark blue. LncRNAs are displayed in green. Blue and purple dots indicate p53 [43, 45] and DREAM‐binding sites [4, 45], respectively. (E) Expression changes of lncRNAs (y‐axis) and their host genes (x‐axis) inferred from 44 RNA‐seq datasets for which log2fold‐change (log2FC) data was available for both genes. The blue lines indicate linear regression (solid line) and its 95% confidence interval (dotted line). The Spearman correlation (R) is displayed with the respective P value. Orange P values indicate 16 lncRNA/host gene pairs with significant positive expression correlation. The four lncRNA/host gene pairs that do not show significant positive correlation are displayed in Fig. S3. (F) Transcripts per million (TPM) values obtained from RNA‐seq data of Nutlin‐3a (orange) and DMSO control‐treated (gray) HCT116 cells. Bar graphs display mean and standard deviation. TPM values from RNA‐seq datasets were compared using a two‐sided unpaired Student's t‐test. *** indicates P values < 0.001.
