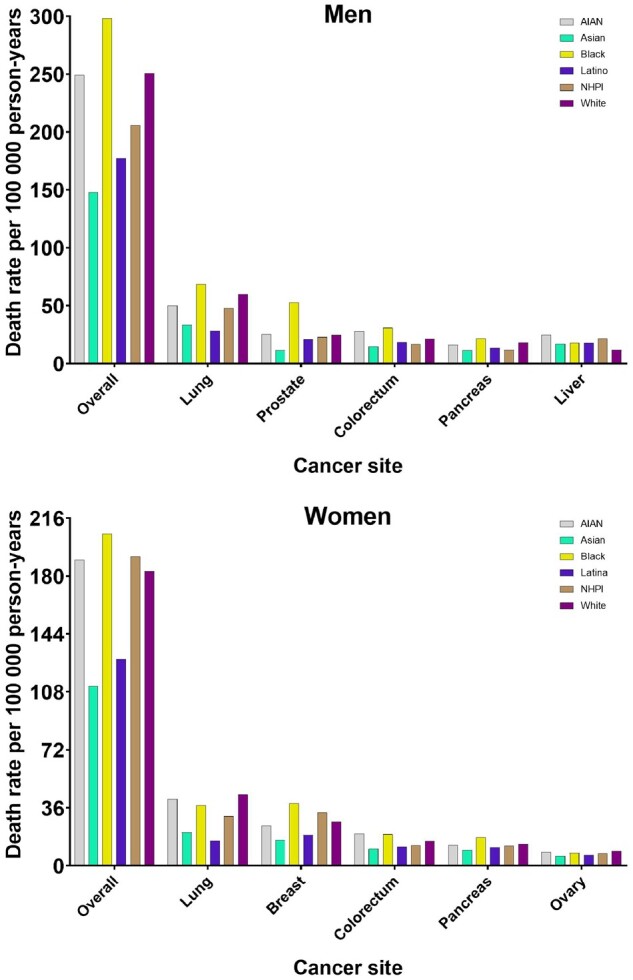
Figure 1.

Cancer-specific death rates for overall cancer deaths and the 5 leading causes of cancer deaths by racial and ethnic groups, stratified by sex from 2018 to 2020, among those aged 20 years or older. Bars indicate the cancer death rates. Colors are consistent by racial and ethnic groups; however, scales differ. AI/AN = American Indian/Alaska Native; NHPI = Native Hawaiian and Pacific Islander.
