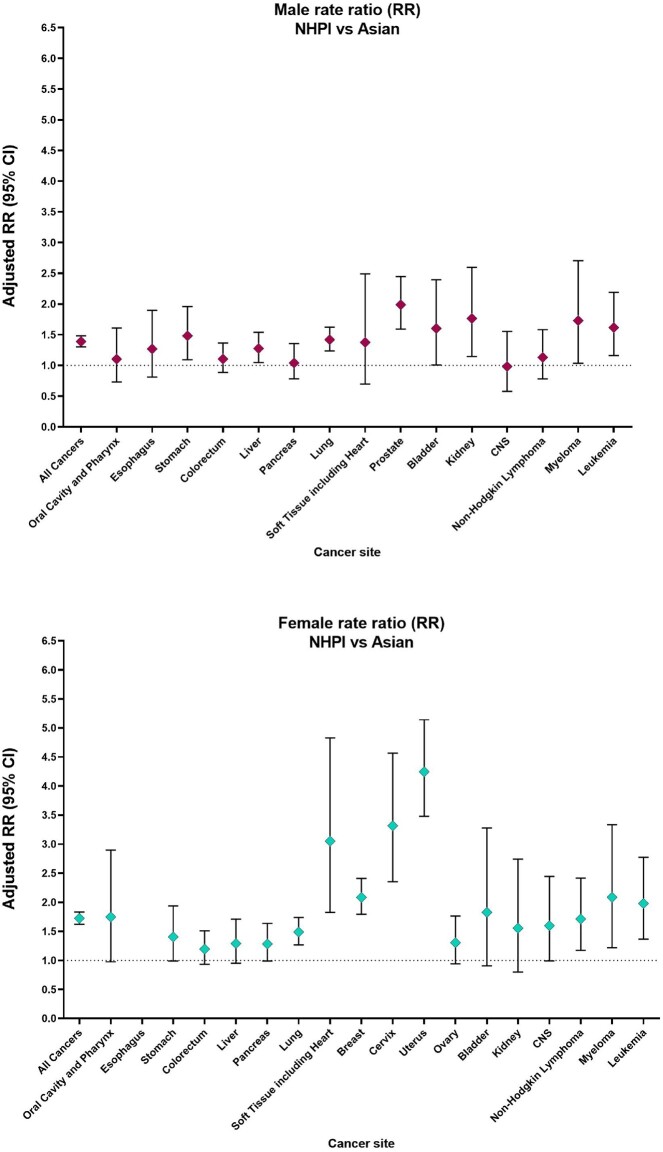
Figure 2.
Cancer-specific rate ratios for the NHPI population compared with the Asian population stratified by sex from 2018 to 2020, among those aged 20 years or older. The diamonds represent the rate ratio. The error bars represent the 95% confidence interval (CI). CNS = central nervous system; NHPI = Native Hawaiian and Pacific Islander; RR = rate ratio.

