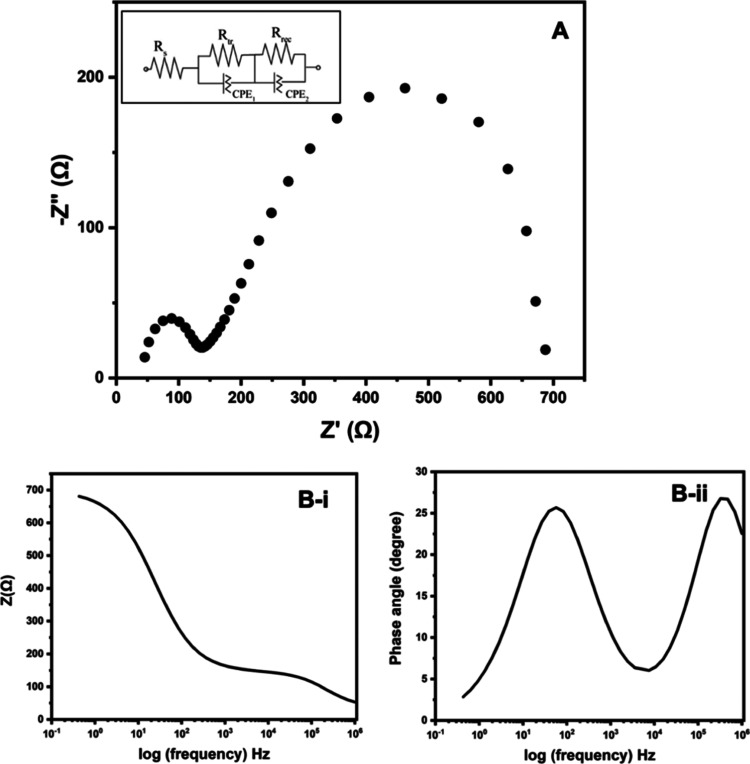
Figure 6.
(A) Nyquist plot, (B-i) Bode plot of total impedance versus log(frequency), and (B-ii) Bode plot of phase angle versus log(frequency) of the perovskite solar cell device described in this research. Inset in figure (A) gives the equivalent circuit that fits perfectly with the experimental results of the Nyquist plot.

