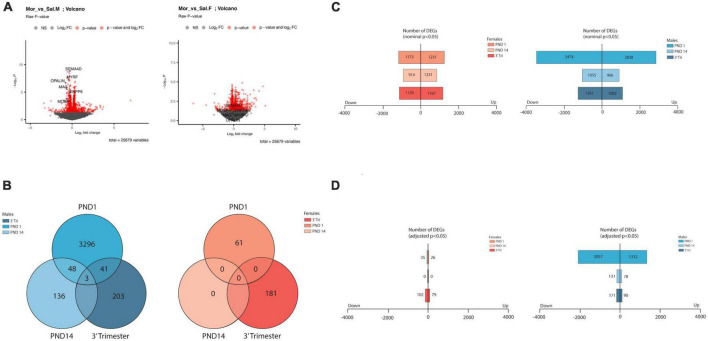
FIGURE 2.
Overview of transcriptome analysis (A) Volcano plots of DEGS from RNA seq from male and female PND14 mice. Log2 fold changes are in the same value range observed for all 6 datasets. In these plots, significant and non-significant myelin-associated genes are highlighted, discussed in more detail in the text. (B) Venn diagrams showing low numbers of overlapping DEGs (Adj p value < 0.05) across treatment group (labeled) and across sex. (C,D) Bar graphs showing total number of DEGS in males and females from all 3 exposure protocols. Top graph numbers represent DEGs with nominal significance p < 0.05 whereas bottom graphs represent DEGs with adjusted p < 0.05 (D).

