FIGURE 5.
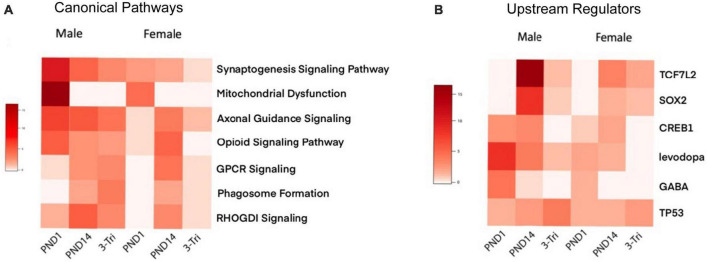
Ingenuity Pathway Analysis (A) Comparison of select IPA canonical pathways across exposure protocols and sex. Heatmap of adjusted P-values, with rows representing Canonical pathways, and the exposure protocol and sex-segregated models shown as columns. The negative log10 of the adjusted P-values is shown in shades of red, with darker reds representing a smaller p-value. (B) Comparison of select IPA Upstream Regulators across exposure protocols and sex. Heatmap of adjusted P-values, with rows representing Canonical pathways, and the exposure protocol and sex-segregated models shown as columns. The negative log10 of the adjusted P-values is shown in shades of red, with darker reds representing a smaller p-value.

