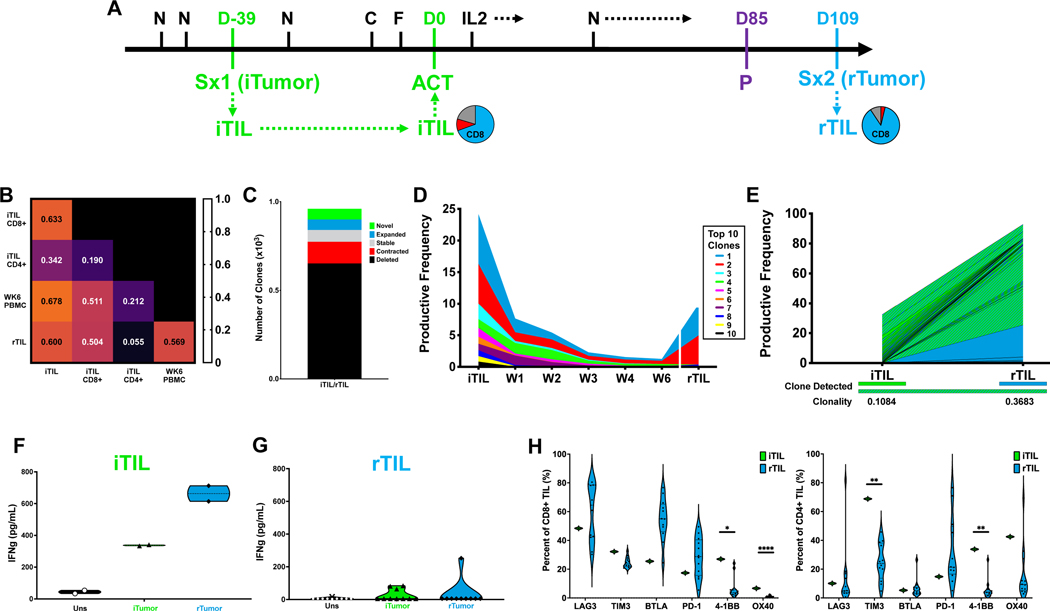
Figure 5. Patient 8 Case Study.
A. Patient treatment schema annotated with CD4 and CD8 ratios for expanded TIL from each surgical specimen; blue=CD8, red=CD4. N=Nivolumab; D=Day; Sx=Surgery; iTIL=initial TIL; C=Cyclophosphamide; F=Fludarabine; ACT=Adoptive Cell Transfer; rTIL=recurrence-derived TIL; P=Progression. B. TCRβ sequence overlap between indicated TIL and peripheral blood samples. C. Absolute number of clones categorized by relative frequency between TIL infusion and six-week apheresis. D. Clonal tracking by TCRβ sequences of the top ten infused TIL clones in peripheral blood samples from long-term responders. E. The top 25 shared clones were tracked by TCRβ sequencing between TIL products generated from resected samples. Individual clones are denoted by color in which samples each were detected. F. TIL and tumor were co-cultured at 1:1 ratio as indicated. IFN-γ concentration was measured by ELISA on cell culture supernatants. Markers represent technical replicates. G. TIL and tumor were co-cultured at 1:1 ratio as indicated. IFN-γ concentration was measured by ELISA on cell culture supernatants. Markers represent rTIL from individual fragments. H. Cell surface expression of checkpoint molecules on TIL by flow cytometry. Markers represent bulk population for iTIL, individual fragments for rTIL. Unpaired T test. p<0.05.

