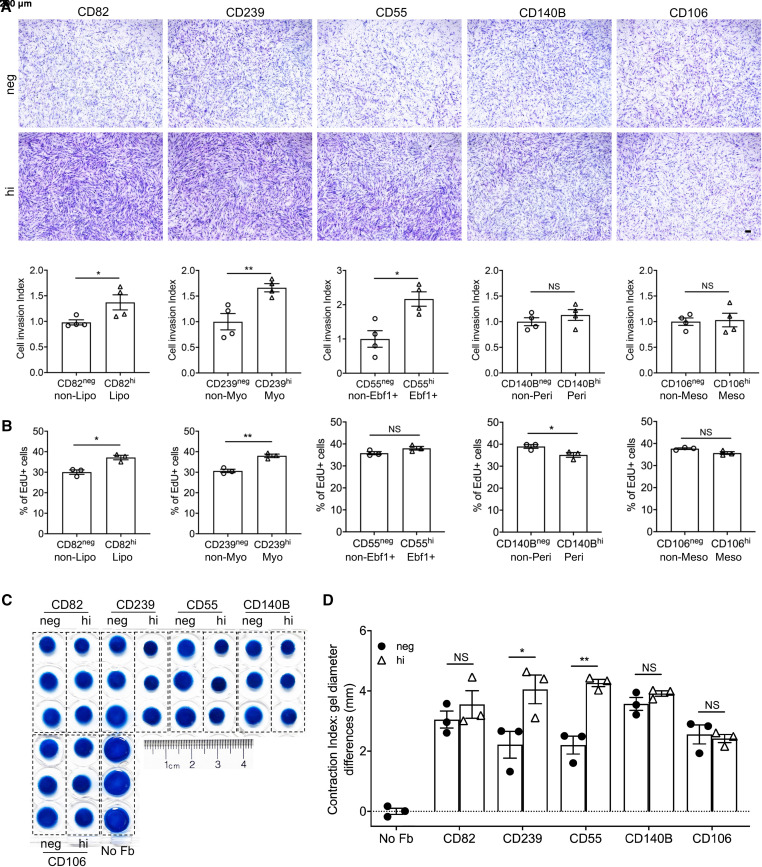
Figure 5.
Invasion, proliferation, and contraction of each fibroblast subpopulation. (A) Representative images and quantification of invasion of each fibroblast subpopulation. n = 4 per group. Scale bars, 200 μm. (B) Cell proliferation rates of the cell surface marker–negative and -positive fibroblast subtypes by EdU assay. n = 3 per group. (C) Collagen contraction induced by each fibroblast subpopulation and (D) quantifications of the contraction diameters. n = 3 per group. Quantitative data are represented as mean ± SEM. *P < 0.05, **P < 0.01 by Student’s t test (A and B) or one-way ANOVA (D). No Fb = no fibroblast control.

