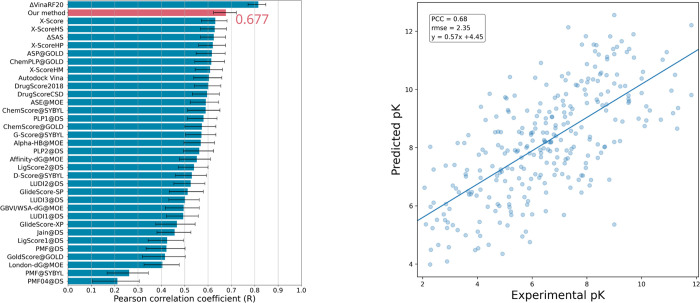
Figure 3.
CASF-2016 scoring power of AQDnet model. Comparison of AQDnet with the scoring functions listed in CASF-2016 (left panel). Error bars indicate 90% confidence intervals obtained from 10,000 replicated bootstrapping samples. Scatter plot of CASF-2016 “coreset” experimental values (horizontal axis) and predicted values by AQDnet (vertical axis) (right panel). Error bars indicate 90% confidence interval obtained from 10,000 replicated bootstrapping samples. The 90% confidence intervals are derived from the CASF-201618 results. Adapted with permission from Ref (18).

