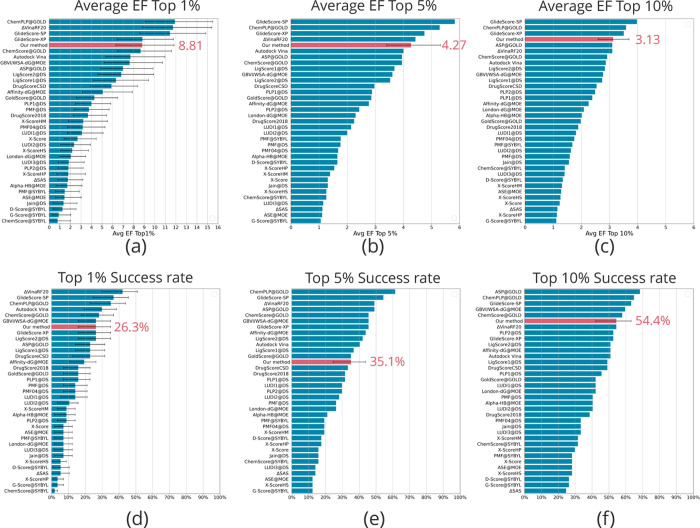
Figure 4.
CASF-2016 screening power of the AQDnet model. Average enrichment factor (EF) top 1/5/10% performance (a–c) and top 1/5/10% success rate performance (d–f) of the AQDnet model (colored pink) and other scoring functions on the CASF-2016 screening power test. Error bars indicate 90% confidence intervals obtained from 10,000 replicated bootstrapping samples. Error bars indicate 90% confidence intervals obtained from 10,000 replicated bootstrapping samples. The 90% confidence intervals are derived from the CASF-201618 results. However, error bars are not shown for those that do not provide 90% confidence intervals in CASF2016 (e.g., Average EF Top 5%). Adapted with permission from Ref (18).

