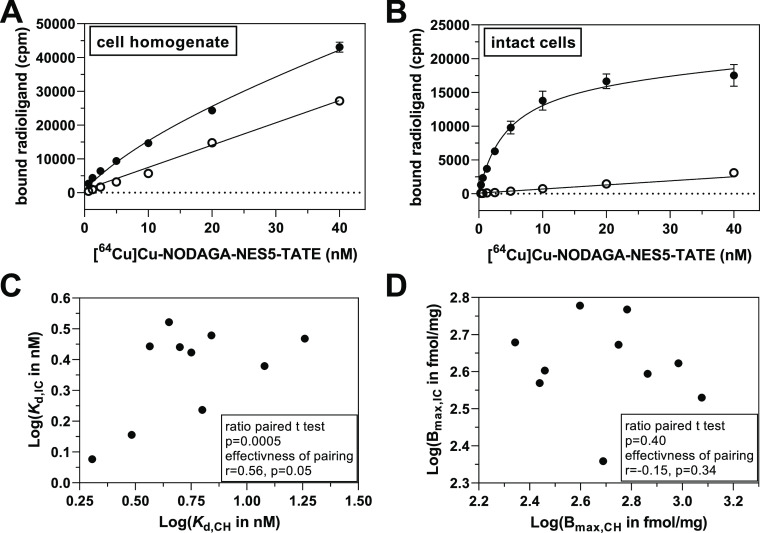
Figure 1.
Comparison of saturation binding data using cell homogenates (CH) and intact cells (IC) (A/B) saturation binding of [64Cu]Cu-NODAGA-NES5-TATE toward MPC cell homogenates (A) and intact cells (B) with data for total and nonspecific binding (in the presence of 1 μM DOTA-TATE) shown as filled and open circles, respectively. Plot in B was published recently by us (Adapted with permission from Brandt et al.17 Copyright 2023, American Chemical Society). Regression analysis was performed by using the model of “one site—total and nonspecific binding” as implemented in GraphPad Prism (Version 9.4.1). (C,D) Correlation plots for the ratio paired t tests of Kd (C) and Bmax (D) data with results of the tests given in the boxes.

