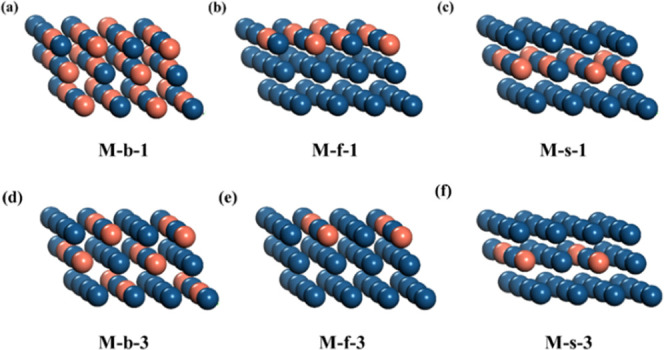
Figure 1.

Schematic illustration of the PtM surface, where M represents a metal promoter. Pt is deep blue and M is orange. (a) Uniformly bulk adding Pt/M in a 1:1 ratio (b), top-layer adding Pt/M in a 1:1 ratio (c), sublayer adding Pt/M in a 1:1 ratio, (d) uniformly bulk adding Pt/M in a 3:1 ratio, (e) top-layer adding Pt/M in a 3:1 ratio, and (f) sublayer adding Pt/M in a 3:1 ratio.
