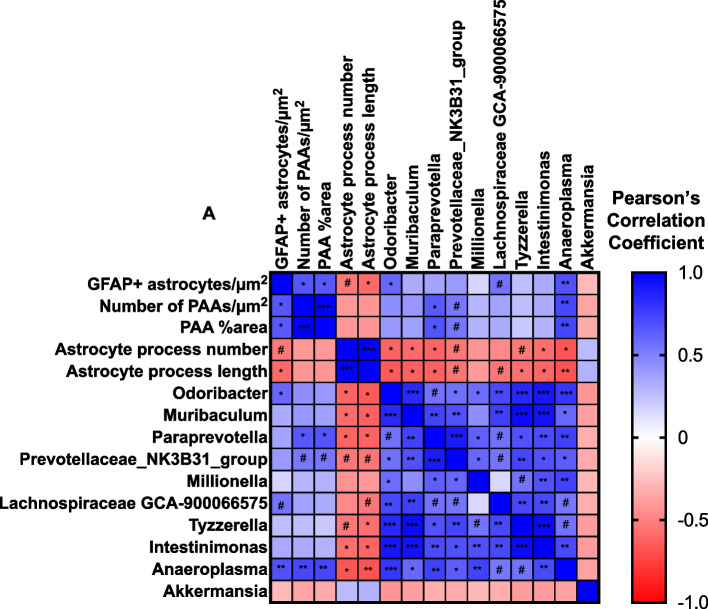
Fig. 7.
Astrocyte phenotypes correlate with bacterial genera altered by abx treatment. Correlational analysis between levels of GFAP + astrocytes/µm2, PAAs/µm.2, PAAs (%area), astrocyte process number, astrocyte process length, Odoribacter, Muribaculum, Paraprevotella, Prevotellaceae, Millionella, Lachnospiraceae GCA-900066575, Tyzzerella, and Intestinimonas, Anaeroplasma, and Akkermansia. Vehicle and abx-treated male APPPS1-21 mice are included in the analysis. Pearson’s R values are represented by colors where blue is a positive correlation and red is a negative correlation. N = 13 mice (6 VHL, 7 ABX). Two-tailed p-values and Pearson’s correlation coefficients were calculated for each comparison. A confidence interval of 95% was used. P and R values for each comparison are available in Additional file 12. * denotes a p-value ≤ 0.05, ** indicates p-value ≤ 0.01, *** indicates p-value ≤ 0.001. # denotes a p-value > 0.05 and ≤ 0.01

