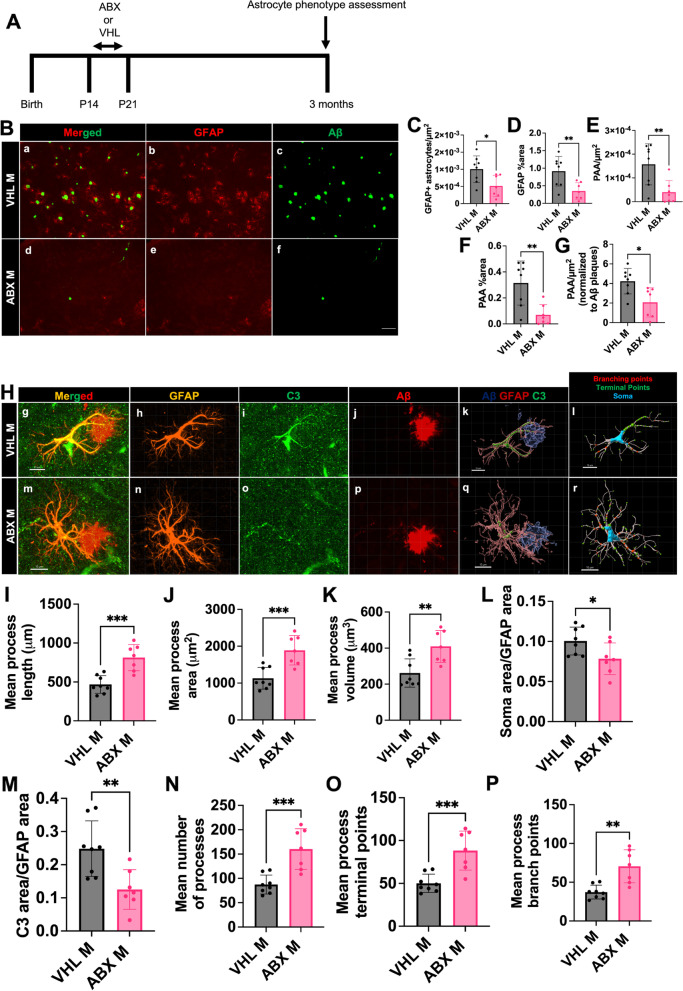
Fig. 8.
Short term antibiotics reduces GFAP + astrocytes, PAAs, astrocytic C3, and alters astrocyte morphology in APPPS1-21 mice at 3 months of age. (A) Experimental schematic. (B) Representative merged (a, d), GFAP (b, e) and Aβ (c, f) immunosignal images from VHL M (a-c) ABX M (d-f). (C) Quantification of GFAP + astrocytes/µm2. (D) GFAP + astrocyte percent area. (E) Plaque-associated astrocytes/µm2. (F) Plaque-associated astrocyte percent area. (G) Plaque-associated astrocytes/µm2 normalized to Aβ plaques/µm2 in VHL male and ABXF male APPPS1-21 mice. (H) Representative GFAP, C3, and Aβ merged astrocyte z-stack maximum projections (g, m), IMARIS 3D reconstructions (k, q), and IMARIS filament 3D reconstructions (l, r) for VHL male (g-l), ABX male (m-r) groups. GFAP (h, n), C3 (i, o), and Aβ (j, p) shown as separate channels from merged images. (I) Quantification and comparison of astrocyte mean process length sum (µm). (J) Astrocyte mean process area sum (µm2). (K) Astrocyte mean process volume sum (µm3). (L) Astrocyte soma area/GFAP area. (M) Astrocyte C3 area/GFAP area. (N) Astrocyte mean number of processes. (O) Astrocyte mean number of process branch points. (P) Astrocyte mean number of process terminal points between VHL male and ABX male groups. M = male. Data expressed as mean ± standard deviation. VHL M N = 8, ABX M N = 7. Statistics calculated using two-tailed unpaired student’s t-tests. 4 sections used per animal. * denotes a p-value ≤ 0.05, ** indicates p-value ≤ 0.01, *** indicates p-value ≤ 0.001, and **** indicates a p-value of ≤ 0.0001. Scale bars indicate 100 µm in B and 10 µm in H

