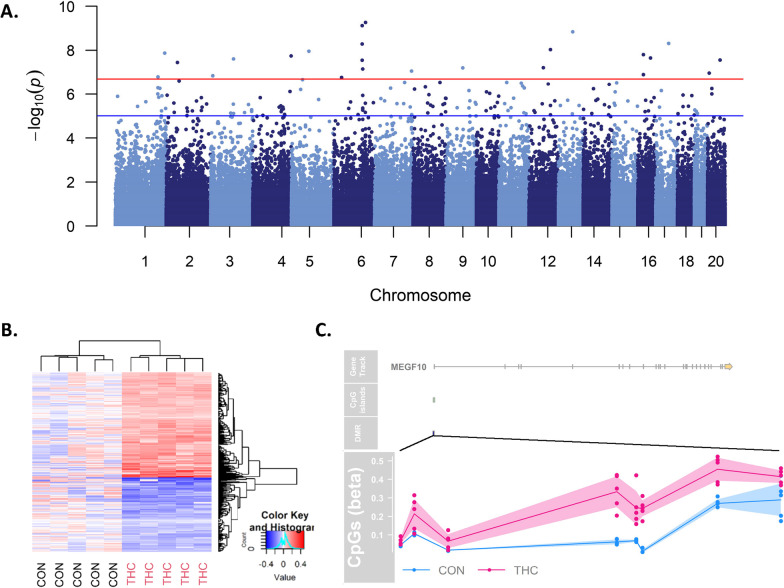
Fig. 2.
Placental methylation is significantly associated with THC exposure across the genome. A Manhattan plot of CpGs in placenta associated with prenatal THC exposure with the uncorrected log10 (p values) plotted on the y-axis and chromosomal location on the x-axis (Mmul_10). The blue line is drawn to indicate CpGs that surpassed p value < 1e−5, a threshold for suggestive association, and the red line is to highlight CpGs that passed a stringent Bonferroni threshold of p value < 2e−07. B Heatmap of placental DMCs passing FDR significance (n = 573 CpGs) clearly separate by treatment group. Values represent the log-transformed and mean centered average methylation values per CpG. C Prenatal THC is associated with methylation changes in placental MEGF10 promoter. Gviz plot [4] showing from top to bottom the gene structure, CpG island proximity, and individual CpG beta values for each animal (THC animals are shown in pink and Control in blue)

