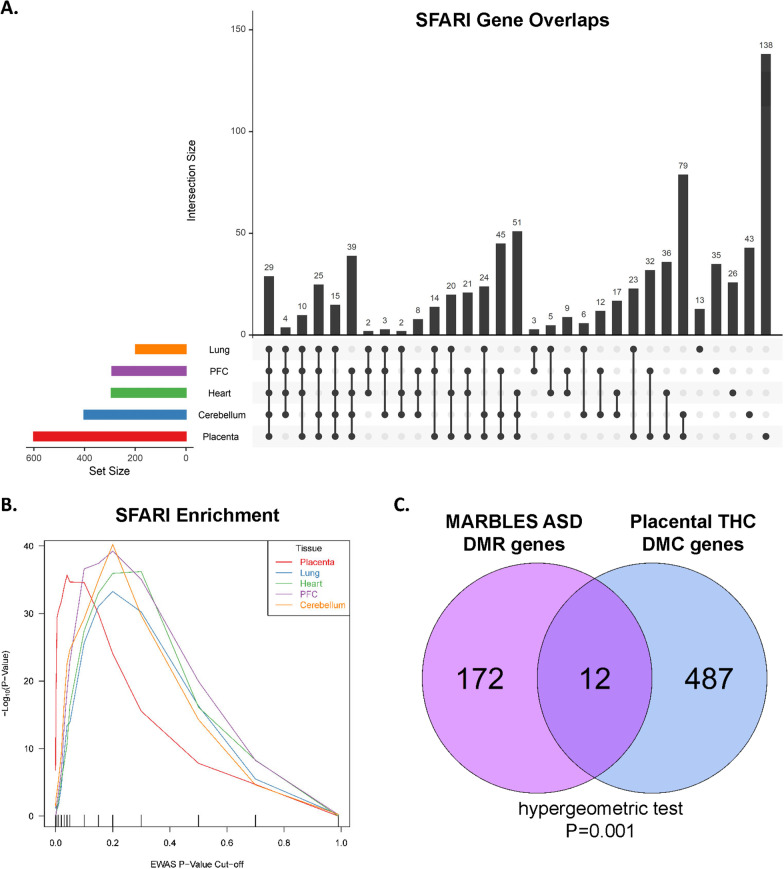
Fig. 4.
Candidate autism spectrum disorder genes are enriched among prenatal THC-DMCs for each tissue type. A UpSet plot of the overlap of SFARI genes annotated to one or more DMC for each tissue. The y-axis represents the number of intersections for each combination of sets across the x-axis. Twenty-nine SFARI genes were represented in DMC lists across all five tissues. B THC-DMC-associated genes were tested for enrichment for SFARI genes across a range of p value thresholds. The x-axis indicates p value threshold for association and the y-axis indicates the − log10 p value for enrichment at each threshold. Line colors represent unique tissues. C Venn diagram demonstrates the overlap of genes annotated to ASD DMRs in a prospective birth cohort study (MARBLES) with placental THC DMC genes. The hypergeometric test was used to test for significance of overlap

